Data visualization: New professionals in demand

Data is the biggest change in the digital society that appeared during the era of the Internet and technologies. Information is exploding: 90% of the world’s data was generated over last two years. Data visualization and analytic view makes possible insights into the information but society, governments and the companies still are not sure how to make the most out of it. Instead, they find themselves faced with overwhelming amounts of data and organizational complexity. But where to find the help? That’s the challenge.
Source: http://www.thefunctionalart.com/p/about-book.html
Data visualization is a commonly used way to analyze the data. Through the visual representation of information it is possible to get a deeper insight into the content and to understand it. According to the data visualization guru Albert Cairo, the first and main goal of any visualization is to assist to “the eyes and brain to perceive what lies beyond their natural reach.” (Albert Cairo 2012)
Data visualization techniques offer a possibility to the audience to explore the datasets in the way that are not possible to see in the numbers. In short, it makes the invisible visible. But proving that data visualization is a brilliant way to get a story out of the collected data is not the point I am seeking for. Well, I admit, it is brilliant. But I am pointing to the tendency of increasing demand for high skilled professionals that would know how to make the invisible visible.
Policy makers are already doing decisions based on the data visualization results: improving the urban environments, discovering trends of diseases to cure or investigating the tendencies of the energy prices. There is a number of different insights that can be seen when looking into the data visualization tree maps, bubble charts or any other chosen model to screen information. Designers, data miners, computer programmers are applying new techniques to visualize the data but the number of such professionals has to increase. According to the data research center IDG, this year organizations plan to invest in skill sets necessary for data specialists employment, including data visualizers – 23%. Does it mean that data specialist is becoming the sexiest job of the 21st century?
Anindya Ghose, co-director of the Center for Business Analytics, and other participants in the video discussion below are approving the struggle to find the talent needed for the market as there aren’t enough skilled people:
Video discusses that soon companies will have to realize the necessity of data specialists in their departments. The explosion of information is not causing confusion anymore. Rather on the contrary. It is already seen that effectively analyzed data is a way to achieve higher level of innovations. So in order to keep going forward to the innovative future organizations, companies or governments will have to improve and the ones that will succeed aren’t the ones who have the most data, but the ones who use it best.
“The visual organization is fundamentally about how progressive organizations today are using a wide array of data visualization (dataviz) tools to ask better questions of their data – and make better decisions,” says Phil Simon, writing about data visualization. He adds: “You’ll see that employees are doing a great deal more than creating simple graphs, bar charts, and pivot tables. Employees are interacting with their data, and learning new things about their businesses in the process. Today more than ever, professionals are being asked to argue their cases and make their decisions based on data.”
Is Phil Simon right? Are all my cited sources correct? In order to find out if predictions about the future of professionals in data visualization are real, I decided to find the answers in practice. TomTom is a dutch manufacturer and a pioneer in creating navigation systems using data. Company’s representative specializing in Data Visualization field agreed to give a short interview and answer few questions:
– What is the demand of skilled data visualization professionals in the market today?
Every year the amount of data created doubles. As the volume increases, it becomes increasingly difficult to retrieve the value from it. As data becomes more important in daily life, more analysis is required. Data analysis and visualization are skills that are in short supply. We are seeing a number of universities create special programmes to help develop the talent that is needed in the industry and will be in the future.
– How high is the increased demand?
There’s really a big lack of such specialists. There has always been a short supply of candidates with the right skills. We noticed that good mathematicians are best in data analysis so we hire them even from abroad. We need professionals because data analysis requires special skills. This field is very specific – if anyone really wants to add certain value to any data analysis, the certain knowledge is needed.
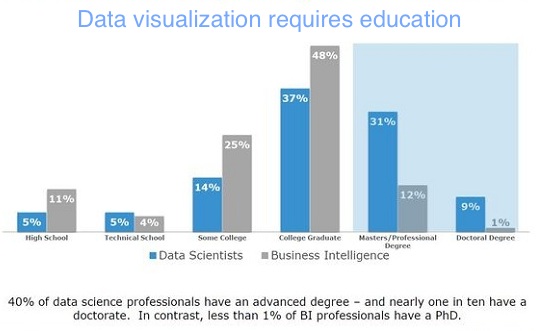
Source: http://servicesangle.com/blog/2011/12/05/3-things-you-need-to-know-about-data-scientists/
For example, if you would like to be a data specialist in any company, then you need to understand of how it works. You cannot learn this at university. There’re certain limits of course but it is a long learning process that needs time investment when already being in the hired position.
– What kind of data will be produced the most in the future?
As we use more devices in our daily lives, more data will be produced. However, we see a significant growth in data from the automotive sector. Cars already produce data from temperature sensors, installed computers, performance management software etc. If we could use all this intelligence, I think it would be tremendous. Just imagine. The companies that will succeed are those that create easy-to-use products from smart data, which help users and customers in their daily lives. Projects and applications based on data will be a game of the future. The challenge will be to understand how to make chocolate out of the big data soup. Computing powers are growing every year because of the better and smarter electronics so in the future it will require more knowledge than ever. Smart data will have many benefits, when used correctly and for the benefit of users.
So the conclusion we could make is that an increasing amount of data and its visualization is still a challenge. There is still a shortage of talent with the right skills to present quantitative information in a meaningful way. Since the world’s information is exploding every year, the need of data visualizers will just increase. So if the student is still looking for a career pathway, this blogpost could be an encouragement – specializing in data visualization is a way to go. It has a lot of potential and will be definitely a demand in the future.
**********
Literature:
Cairo, Albert. “The Functional Art: An introduction to information graphics and visualization.” 2012:10.
Dorie, Clark. “Data visualization is the future.” Forbes. 02 04 2014. <http://www.forbes.com/sites/dorieclark/2014/03/10/data-visualization-is-the-future-heres-why/>
Big Data. Research reports. IDG Enterprise. 05 04 2014. <http://www.idgenterprise.com/report/big-data-2> Thomas H. Davenport, D.J. Patil.
“Big Data, for better or worse: 90% of world’s data generated over last two years.” ScienceDaily. 10 04 2014. <www.sciencedaily.com/releases/2013/05/130522085217.htm>
“Data Scientist: The sexiest job of 21st century.” Hbr. 10 04 2014. <http://hbr.org/2012/10/data-scientist-the-sexiest-job-of-the-21st-century/ar/1>
“Things you need to know about data scientists.” Service angle. 10 04 2014. <http://servicesangle.com/blog/2011/12/05/3-things-you-need-to-know-about-data-scientists/>

