Data Visualization and Political Elections
According to Bernhard Rieder’s presentation “The contextualized history of data / information visualization” there was always a necessity of visualizing the information we gathered throughout centuries about the world. Through the curiosity and the hunger for knowledge of the human mind we have created the necessity to immortalize and to order the data we already gathered while we were exploring the unknown limits of the world. This process is ongoing but we will still be trying to satisfy our hunger creating the world almost unrecognizable to us. The limit seems to be the sky since the ideal presented couple centuries ago is still the goal to reach for the human kind:
“If statistics continues to make the progress it has made for several years now, if the information it provides us with continues to become more perfect, faster, more regular, steadily multiplying, there might come the moment where from every social fact taking place springs – so to speak – automatically a number that would immediately take its place in the registers of the statistics continuously communicated to the public and distributed in graphic form by the daily press.” ( Tarde 1890 )
The presence of the data visualization in the politics though is existent since the end of 18th century when countries were reforming themselves introducing bureaucracy into the state. Due to the industrial revolution, the urbanization and the growing consumerism of the countries the need for the analysis of these social changes emerged in order to control the country through the prediction of the social behavior of its citizens. The social science was born and its main instrument next to statistics was the data visualizations.
The use of the visual analysis of the countries expanded onto the politics as well, creating for a government a possibility to analyze the previous elections and therefore to predict the results for the upcoming ones. The usage of the visualization of the data gathered form the elections is well illustrated in this picture:
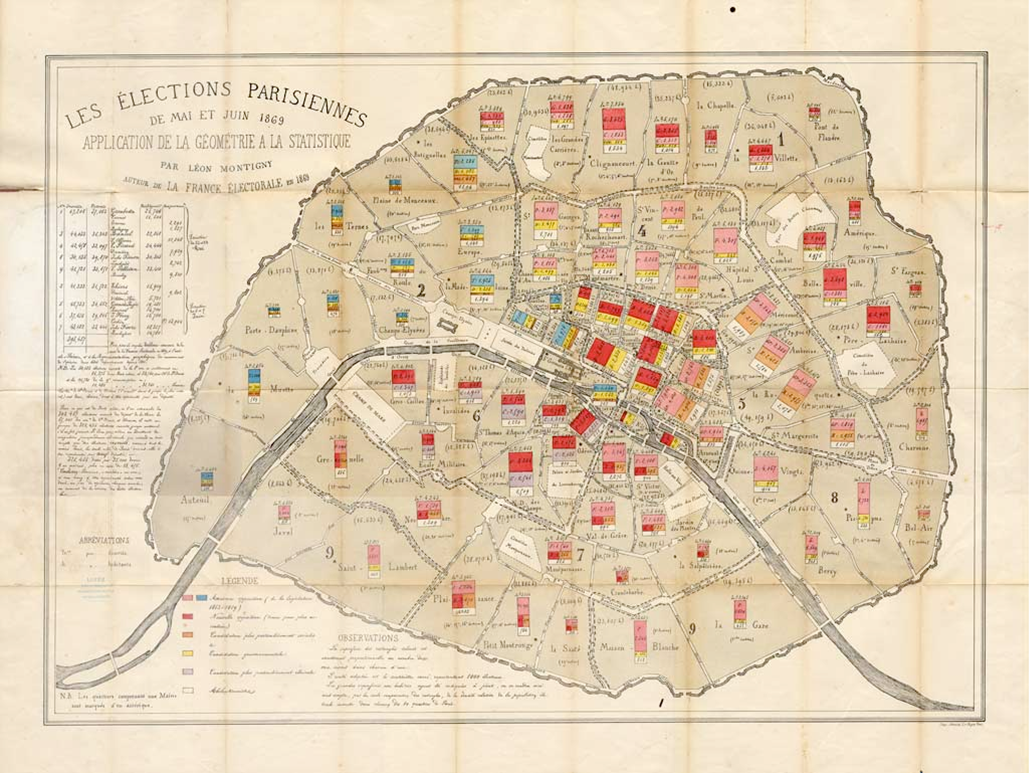
This illustration presents the election results in 1863 in Paris, France. The colors marked on the districts of the city present the political party. Based on this picture someone could draw an assumption that the favors of the voters would not change for the upcoming years, therefore the outcome of the elections per district would be the same. The studies have shown, according to Rieder, that in these districts of Paris even after couple centuries similar political parties are being favored to the political parties in this picture. The preference for the political parties must be rooted deeply into humans psyche and influenced by sociological, historical, and cultural factor as well. As if the historical and political progress of the country didn’t matter. The same notion came to my mind after the midterm election in Poland in 2007 when the election results resonated surprisingly with the borders emerged in Poland due to the Partitions of Poland in 1795:
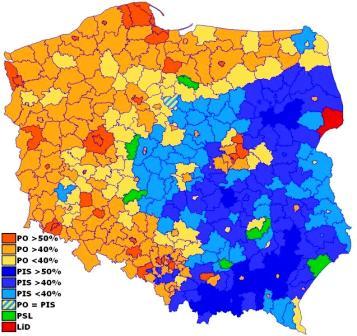

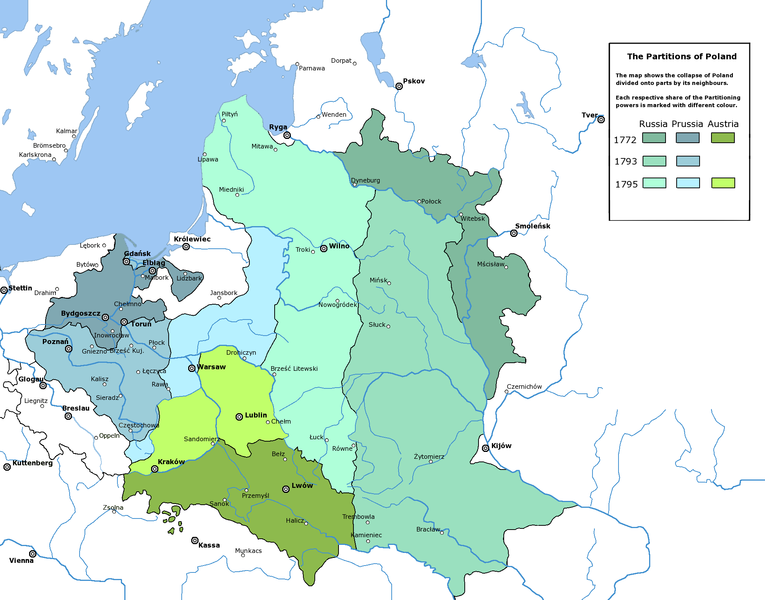 This picture illustrates three maps: first of the midterm election results of 2007. The map below is of the Third Partition of Poland in 1795. The third not precise map of Poland resonates the partition borders in what you could say today’s Poland where you could obviously read the favors of the voters towards conservative political parties aligned with the borders of Russian and Austrian Partition of Poland, and liberal political party which aligns with Prussian Partition of Poland.
Presented above examples constate the fact that data visualizations of political elections illustrate the possibly lasting for centuries political favors of the voters. The visualizations of the elections trace also the voting patterns and behaviors. This provides the tools for analysis of the voters’ patterns and changes of the voter’s behavior when influenced by the other factors than presented above, the studies still have to explore.
No wonder then that when upcoming elections are being announce the results of the previous elections are being analysed:

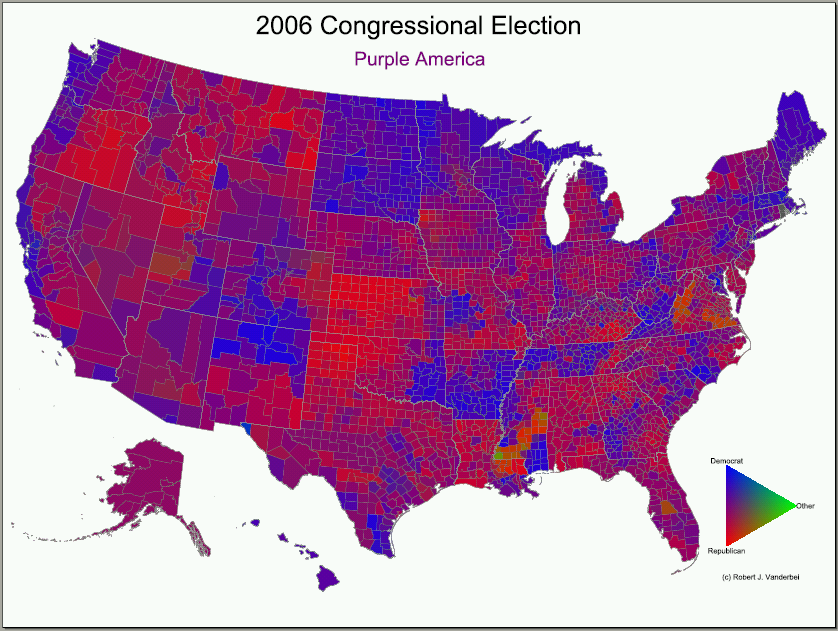
2010 Congressional Election

The new methods of data visualizations are being introduced next to old one and exercised in order not only to clarify the voting patterns but primarly to predict the voting behavior of the voters in the upcoming elections taking into the consideration every aspect of the recent political, historical, sociological and technological development through the analysis of the statistical data aside with braking down the speaches of the potential canididates. No wonder the recent elections took polls out of the social network websites; which primarly was reserved as a social platform for finding friends if you are lacking of them in the reality or presenting an opinion which in the reality no one would pay attention to; and not as potical platform for the politicians to present their campaign together with their opinions about the last TV show, and critical approach to all the media covering the elections written beatifully in the instant text language and with the typographical errors every high school teenager is familiar with but still being capable of sticking with the language requirements while writing an essay.
But all of this development of the data visualization creates a danger. If Tarte was right about the undeniable progress of the development of data visualization leading to the society where every social event is being automatically and digitally stored and analysed it brings up the question if really every data is equally worth analysing then? Not for our peace of mind, nor to prevent undermining the authority of the scientifical research. For the future generations, really, to prevent a shameful feeling in our grand grand children when they will have to read all of this in the history books and asking us what were we thinking?
I just think, not every data has a political or electional significance, just because the politics is a serious business and it should be treaten seriously.