Dust in the wind: On air pollution and objectivity
Abstract
By comparing Robert Boyle’s measuring device to subtract data about corporal particles and air pollution visualization app the Breezometer I try to show that how and which data is being subtracted depends on a socio-cultural matrix in which measuring practices are being enacted.

All they are is dust in the wind…
An old saying has it ‘History always repeats itself’. Robert Boyle, natural philosopher, co-founder of the Royal Society of London and of modern science in general, published in 1674 an essay called Suspicions about some Hidden Qualities of the Air. This booklet, a mix of physics, astronomy and astrology, notes the possibility that stars, planets and other luminaries emit, next to light and heat, corporal substances which reaches our planet and mixes with the air. Boyle proposed an experimental method, based on having air flow through magnets in various locations, times and temperatures to discover the different ‘natures’ of air and the possible correspondences between the celestial and the sublunary (Rutkin, 552).
Boyle’s interest in air is reminiscent of the current scientific, technological and academic research and debate around air in general and air pollution in particular. Take for example Peter Sloterdijk’s recent phenomenological and existential approach “the modern subject can be defined by its breathing conditions, not only who can and can’t breathe but also who has access to which qualities of breathing” (Sloterdijk, 2009). Another take is John Durham Peters intriguing take on air as means of existence or basic shaping of our environment: what does breathing air mean for cetaceans like dolphins and whales who spend most of their life under water? (Peters, 64) Most contemporary research doesn’t focus on this conceptual side of air, but rather takes it as empirical object of study: as something that generates data. But if history repeats itself, what is it that repeats and what differs at each recurrence? To answer this I will take a look at the Breezometer and compare it to Boyle’s measuring device.
Visualizing air pollution
The Breezometer (2016), developed for Android and IOS is, according to their page, ‘the world leader in hyper-local air quality data’ and is the most downloaded air pollution app tracker on the market. Its functionality seems to revolve around the visualization of the degree of air pollution on specific locations. It does this by either showing, through their ‘Air Quality Index’, the percentage of clean or polluted air in the area or by showing a map and indicating by colors which areas are polluted or not. Next to being an app it also has an API functionality for other systems, which enables other apps for instance to operate as air quality forecasters, showing pollution heat maps, facilitate historical air reports and actionable health recommendations to name a few.

Apps like these fit within the broader discourse around air pollution or smog of the last decade. One of the things this app does is showing that air pollution isn’t only an abstract global problem but rather “Air has a location, and polluted air has a location whether or not that lends itself to immediate perception” (Parikka, 17). The app makes users aware of their surroundings and invites them to act upon their environment either by finding measures to reduce pollution or to avoid polluted areas. But as Jussi Parikka notes “Issues of seeing are increasingly dealt with in terms of visibility of data even if the infrastructure of how data is being collected and with what effects is more interesting than merely visual perception” (11-12).
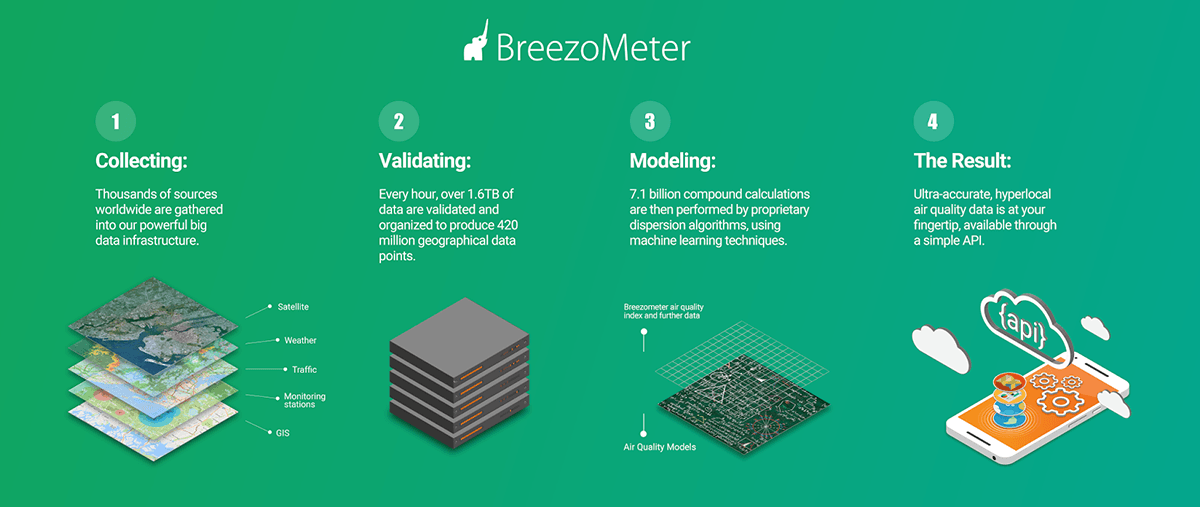
Breezometer uses ‘Advanced Algorithms and Big Data’ to measure air quality, on the technology section of the Breezometer page they explain in four steps how the system operates. First, collection of data through government and alternative air quality monitor devices, satellites and GPS, secondly, validating 1.6TB data every hour which is being organized to produce 420 million geographical data points. Thirdly, modelling by proprietary dispersion algorithms of 7.1 billion compound calculations using machine learning, fourthly resulting in ultra-accurate, hyperlocal air quality data, available for the app and API. Different questions could be asked in regards to this operation and data-collecting system in line with topics like dataveillance, governmentality and big data studies. Yet what I want to show in this post is that measuring devices and data aren’t just technological determined or socially constructed, but are embedded in a broader complex which co-determine its functionality and vice versa. The result will be a better understanding what is being repeated in history and what differs.
The question of objectivity or what is a dispositif
Air monitoring system and air measuring magnets are on a very basic level less innovative as they seem “What we call ‘new’ media, data-processing devices which collect, analyze and distribute raw data, have a long history through indexes, registers, calendars and catalogs to name a few” (Peters, 19). Subtracting data has a long history; measuring air for instance goes all the way back to Ancient Egypt and Greece through ornithomancy (the practice of reading omens from bird flight), astrology, fire signals or simply navigation. What is relatively new is the interest in air as substance made of and containing particles.
But a device like a magnet or an air quality monitor systems isn’t itself what defines historical change: we can use the same magnet as Boyle to measure air quality, just as Boyle (with what imagination) can use a data collecting device to trace corporal particles. What makes them divergence is the dispositif in which these devices are embedded. A dispositif, or apparatus as it is known in the English speaking world, is a heterogeneous ensemble made of discourses, institutions, mater-reality, social-practices and technologies which mutually shape, enhance and propagate each other (Ruppert, 10). What is unique for every measuring practice is the dispositif in which it is enacted, it is that determines how and in regards to what a certain technique is being used. In the case of Boyle one could name for instance the newly developed empirical method by Francis Bacon, the constitution of the Royal Society in a war plagued England followed by a strict monarchy, his personal interest in alchemy and astrology and the countless instruments that he used to enhance and enforce his measurements. Analogically to this we can’t understand the Breezometer without taking in mind the broader infrastructure consisting of “computer networks, scanners, algorithms, software and applications to different actors, institutions, regulations and controversies” (Ruppert 10) in which this technology is embedded and data is defined/collected/produced. Although the basic act of measuring air remains the same in both cases they only find their concrete realization in concrete practices that radically diverge form each other.
But measuring is as much about socio-technological practices as it is about subtracting objective data from research objects. Whether an object is measured in the mid-17th or beginning of the 21st century that object and the generated data should be objectively equal under identical circumstances. The only supposed difference is that the strategies and criteria through which data are collected are improved over time. But if objectivity functioned in this way, Aristotelian and Cartesian science should be complementing instead of replacing each other. The reason for this is that although both are equally objective on their own terms, the way how objectivity is described “is situated and historically specific” (Gitelman, 4), meaning that objectivity is formed within the earlier mentioned dispositif that defines our knowledge objects and the principles under which we can objectively know such objects.
This has major consequences for the data being subtracted from these objects “how data are ontologically defined and delimited is not a neutral, technical process, but a normative, political, and ethical one that is often contested and has consequences for subsequent analysis, interpretation and action” (Bowker & Starr quoted in Kitchin, 22). The dispositif determines how an object should be understood, which data should be subtracted and what conclusions can be made from those results. Not only is Boyle looking for a very different type of air particles then ours – whereas Boyle aimed to analyze supralunary corporal particles the Breezometer focusses on Sulfur Dioxide (SO2), Nitrogen Dioxide (NO2), Carbon Monoxide (CO) and Particular Matter (PM); the cause for this divergence are different epistemological backgrounds as products of specific dispositifs which generate different understandings of air particles. It also conditions under which parameters an object should be analyzed or can be known – next to temperature and time the positions of the planets counted as central for Boyle’s analysis, something that no scientist in our times would include in their research on air pollution. Just as much devices are embedded in a socio-technological matrix so is it equally important to understand data as being based on a situated objectivity that is shaped by technological, material, political and economic influences that determines which objects according to what parameters will be analyzed.
Conclusion
History always repeats itself but on condition of being different. What stays the same is the tendency to measure and collect data, but this practice is always done in different contexts and dispositifs. Data, devices and objectivity shouldn’t be understood as universally and a-historically givens but rather as produced through and in relation to heterogeneous ensembles which shape what and how something is analyzed “It is a kind of mysticism that can only be expressed in the dust of this planet” (Thacker, 156).
References
Gitelman, Lisa. (ed.) Raw Data Is an Oxymoron. Cambridge: MIT Press. 2013.
Kitchin, Rob. The Data Revolution: Big Data, Open Data, Data Infrastructures and Their Consequences. 1 edition. Thousand Oaks, CA: SAGE Publications Ltd. 2014.
Parrika, Jussi. “The Sensed Smog: Smart Ubiquitous Cities and the Sensorial Body.” The Fibreculture Journal. Vol 29 (2017).
Peters, John Durham. 2015. The Marvelous Clouds: Toward a Philosophy of Elemental Media. Chicago IL, London: The University of Chicago Press.
Ruppert, E., Law, J. & Savage, M., 2013. Reassembling Social Science Methods: The Challenge of Digital Devices. Theory, Culture & Society, 30(4), pp.22–46.
Rutkin, Darrel. “Astrology.” The Cambridge History of Science, Vol. 3, Early Modern Science, eds. Katharine Park and Lorraine Daston, Cambridge: Cambridge University Press, 2006. 541-561.
Sloterdijk, Peter. Terror from the Air, trans. Amy Patton and Steve Corcoran. Los Angeles: Semiotext(e), 2009
Thacker, Eugene. In the Dust of this Planet. Washington: Zero Books, 2011.