Have You Gone Green? INFRAWARE as a Digital Intervention for Environmental Awareness
INFRAWARE (composed of the words infrastructure, awareness and hard/software) is a browser plug-in that displays how your personal use of technology is deeply entangled with the planet’s resources and the environmental crisis we are currently experiencing.
Go green. Paperless billing. Cloud computing. We’ve heard these phrases urging us to turn to the digital in order to save the planet. But the reality of our situation is much more complicated.
Let’s start at the beginning: a 6-year-old child in the Democratic Republic of the Congo risks his life to mine for cobalt. This is sold to Chinese “buying houses” and shipped to China, where it will be used to make the rechargeable battery in your phone. The factory, which produces waste in the process, ships the packaged product around the world. Not only will you consume electricity to continually recharge your phone, but your online activity will also have impacts on our environment. Data consumption is felt through power demands on major data centers. As you consume content, major tech companies utilize resource-intensive tactics to track your consumption and target advertisements. And this is only a small piece of the larger puzzle.
While this may sound overwhelming, the point here is not to scare you into cutting ties with media technology. Rather, we’d like you to be aware of the environmental (and human) impact of media technology, and to understand that the issues we face are vast. The internet and climate change are ‘hyper-objects’ in that they are impossible to define or fully grasp. No single person has a complete understanding of how these issues work, how many actors are involved, or the totality of the effects. What is possible is for us to become more aware of the media infrastructures in place, their environmental impacts, and our ability to push for change.
That is why we have developed INFRAWARE, a browser plug-in that makes visible the invisible, providing information about the materiality of online activity. INFRAWARE begins to peel away at the layers of disconnect between consumers and technology – helping us to understand where both physical technologies and digital content come from and helping us to imagine the complex, infinite, and tangled effects that these have.
We are in a crucial moment in human history. The proliferation of media technologies coupled with the ever-expanding environmental movement has forced us to reexamine our conceptions of environmental crises, digital rights, and human rights. For too long, the tech industry has had control of the narrative. With INFRAWARE, we hope to rewrite it – filling in the gaps and making connections that have intentionally been left out.
Visualizing the Invisible? INFRAWARE’s Methodology
To a large extent, the development of INFRAWARE draws on the concept of the “hyperobject” as described by philosopher and literary theorist Timothy Morton. Morton describes global warming as a hyperobject in that it is invisible on a relatable scale and time frame. Hyperobjects are intensively real, but as humans we cannot fully grasp them (23–38). Phenomena such as the daily local weather or a storm are comprehensible to us, but it is difficult to place them on a vast historical and future time scale or understand their influence on a global scale.
Following Morton’s description, the internet itself can also be understood as a hyperobject: We use it on a daily basis but we cannot fully comprehend the complexity and scale of interconnected technology. This is aggravated by the fact that large parts of the material infrastructure of the internet are hidden from the human eye on the seabed, underground or in orbit.
The fact that hyperobjects are distributed on a global scale, while growing their roots as well as emitting their impact locally, leads to a constant disconnect between individuals’ local experiences and the global implications of their actions. One way in which INFRAWARE attempts to visualize such disconnects is by highlighting the current nature of user-machine interactions. As media scholars Gauthier & Dieter put it, “Between a user’s expectations at the interface, and how information is processed, queued and technically resolved across globally dispersed communication infrastructures, there exists an intractable experiential lag or gap” (62). For Mattern then, new media objects and their communication networks tend to inherit a certain degree of “ontological slipperiness.” To visualize such hyperobjects must then be understood as an attempt to close the gap between local and global and to provide users with a grasp on what usually tends to elude their online experience.
On top of that, INFRAWARE’s approach to user-machine visualization is complemented by the insight that global climate patterns are nothing else but hyperobjects on the other side of the same coin – the digital and the environmental are deeply intertwined. It is not sufficient to simply highlight that there exists a distance between individually experienced actions and their global impact, we also need ways to “map these systems so as to reveal […] how they shape our daily experience — and even structure a new mode of infrastructural existence.” (Mattern). Star & Bower claim that infrastructures are essentially political in that they provide the very foundation on which action can take place, while at the same time they tend to standardize practices and habits, thereby stiffening opportunities for alternative practices to emerge (239f). Climate action then needs mapping approaches on the basis of which it can define alternative infrastructures that provide their function while simultaneously co-existing with the planet in a more elaborate manner. Mapping the hyperobject becomes therein the central feature on which the INFRAWARE plug-in is built.
Designing INFRAWARE
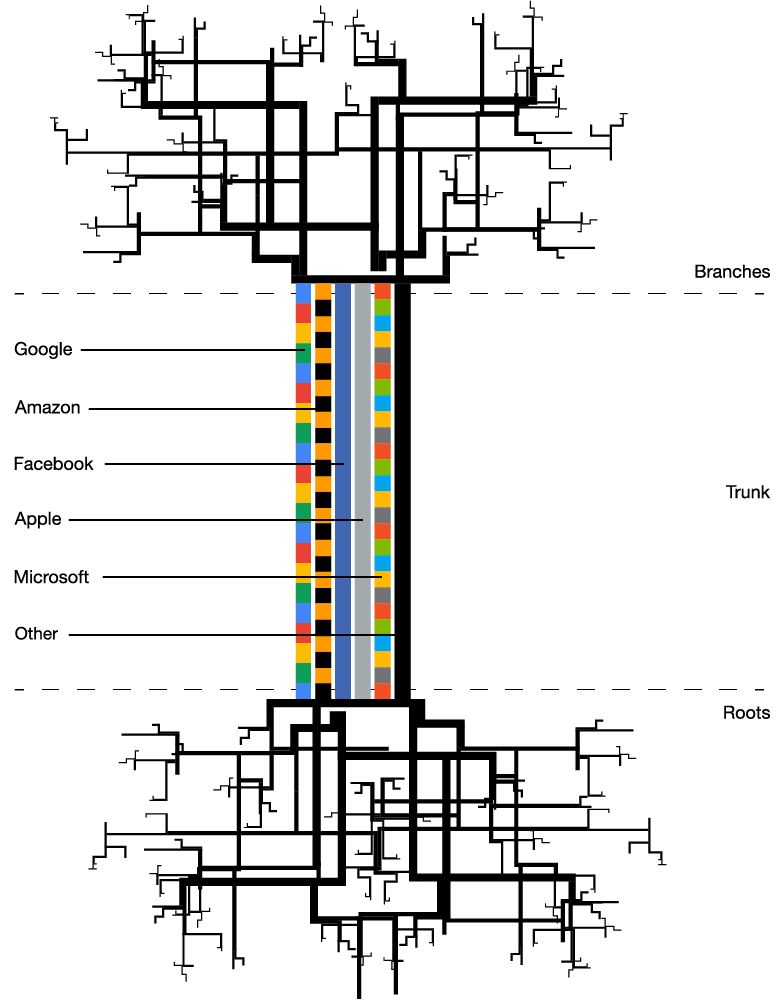
One way to think of the internet as a hyperobject is through the metaphor of the tree. The design of INFRAWARE is deeply inspired by this comparison. In a podcast on ‘The Platform Society’, the media and digital society scholar José van Dijck explains that this metaphor serves as an attempt to better understand the digital and material infrastructures behind existing platforms (Bossetta).
According to van Dijck, we can understand the roots of a tree as the wiring layer of the internet (Bossetta). It resembles the material infrastructure that makes digital communication possible. Such material infrastructures include for example computers, mobile phones, microchips, satellite systems for 4G and 5G communication and actual cables that go into the ground or into the ocean. For Van Dijck and other scholars (e.g. Plantin et al. 306), this material layer increasingly becomes a service offered by platforms. It is through these developments that we can connect the tree’s root to its trunk — or the “intermediate layer” of the internet (Van Dijck in Bosetta).
The trunk then consists of presumably 70 platforms that are mainly operated by the Big 5 technology companies (Van Dijck in Bosetta): Google, Amazon, Facebook, Apple and Microsoft (GAFAM). These companies increasingly provide the infrastructures smaller platforms run on, and therefore can be seen as the connection between the tree’s roots and its branches (Van Dijck, Poell & De Waal pg nr.).
This dynamic is visually depicted in the INFRAWARE plug-in icon that consists of six lines, meant to represent cables; of which five represent the brand colours of Google, Amazon, Facebook, Apple and Microsoft. The sixth line is meant to represent companies, who provide infrastructures on a smaller scale and additionally gives INFRAWARE’s users the opportunity to add their own information regarding digital infrastructures and their energy use.
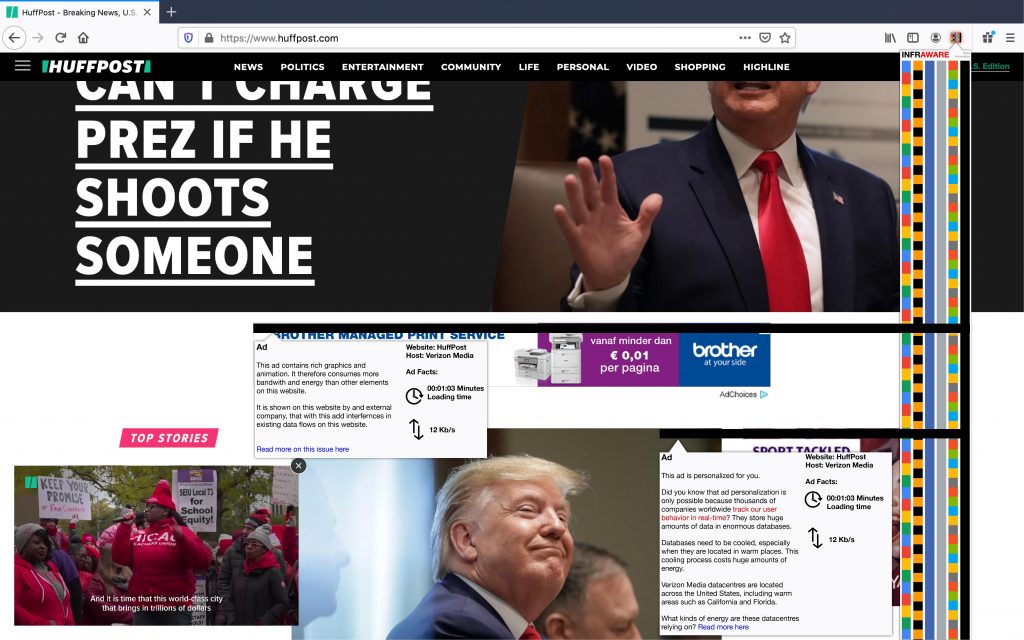
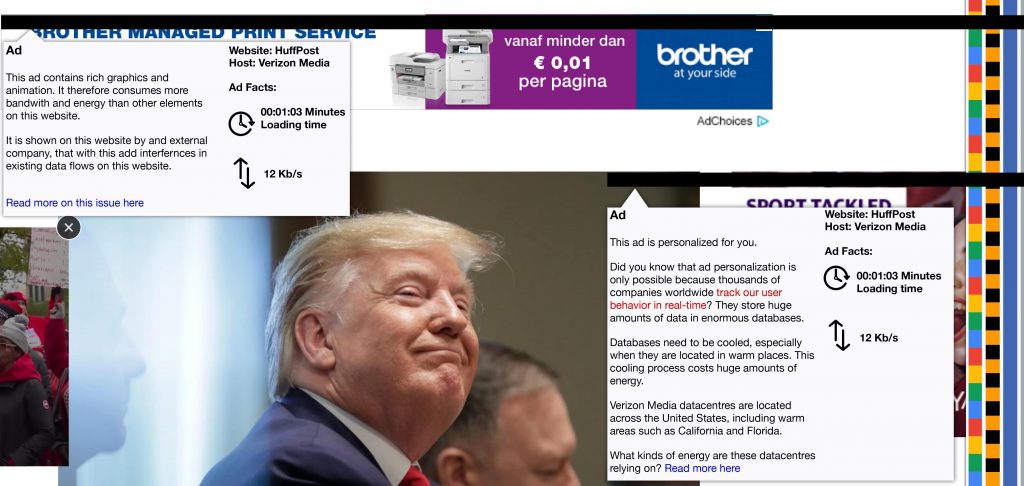
As soon as a user visits a website on which infrastructural information can be provided, the logo lights up red (figure 2). Once the icon is clicked , a visual layer appears on the website. This layer shows the visual trunk of the tree consisting of six cables, as explained above. If a user hovers over a particular website element (e.g. an ad or a social media button), this element will be connected to involved platforms represented by one of the cables, on the visual trunk of the tree. At the same time, a screen will appear on top of the particular element which contains specific information regarding the underlying infrastructures of this element. Such a screen, for example, contains information about energy consumption, IP-locations of data centers or advertising infrastructures. The following two case studies illustrate the plug-in features. First, features in the context of online advertising will be discussed. Secondly, we cover the topic of video streaming on Netflix, one of the largest contributors to online video traffic as to video streaming’s environmental impact (Cook 67).
Case Study 1: Online Advertising
Highlighting different visual (e.g. Like-Button) and non-visual (e.g. tracking pixel) page elements, INFRAWARE will shed light on the complex and ubiquitous network of commercial surveillance that pervades the web, mainly for the purpose of ever more precise and individualized advertising.
This network includes social media companies which track users on their platforms, but also throughout other parts of the web by making “external web data platform ready” (Helmond 21). Moreover, a plethora of different companies – of which the average users has never heard of – form a more decentralized ‘surveillance’ network: advertising exchanges, data brokers and many others act as intermediaries between publishers and advertisers (Christl and Spiekermann).
While certainly acknowledging the serious implications of these data collection practices, INFRAWARE highlights the environmental impact of commercial data collection for online advertising purposes.
First of all, the practice of user tracking relies on a complex physical infrastructure and requires a lot of energy. We only receive highly personalized ads because thousands of companies worldwide track our user behavior in real-time, store huge amounts of data in enormous databases, and make inferences through CPU-intensive calculations. INFRAWARE makes this visible by ‘tracking the trackers’.
Second, loading the ads themselves is highly energy-intensive. “Online ads use rich graphics, animation, and video, which consume more processing and energy than the rest of the content” (Pärssinen et al. 180). Notably, ads and tracking are often given preferential treatment in the chrono-design of a website (Dieter and Gauthier 78). INFRAWARE points to these aspects wherever there are visual ads on a page.
Moreover, the plug-in highlights non-commercial spaces on the internet and organizations which advocate for an internet that is not driven by commercial interests but social values. Among other facets, this is meant to ask users the pressing question: Does online advertising in its current state hinder us from reaching a sufficient global consumption level within our planetary boundaries? In fact, online advertising increases consumerism and impulsive purchases even more than its analogue counterpart (Bleier & Eisenbeiss). We try to reflect these dynamics through the INFRAWARE interface: Questions like “Do you really need this?”, “If yes, does it have to be new?” or “If still yes, did you look for the most sustainable choice?” will pop-up in the browser, once the plug-in is installed.
2.2 Case Study 2: Video on Demand
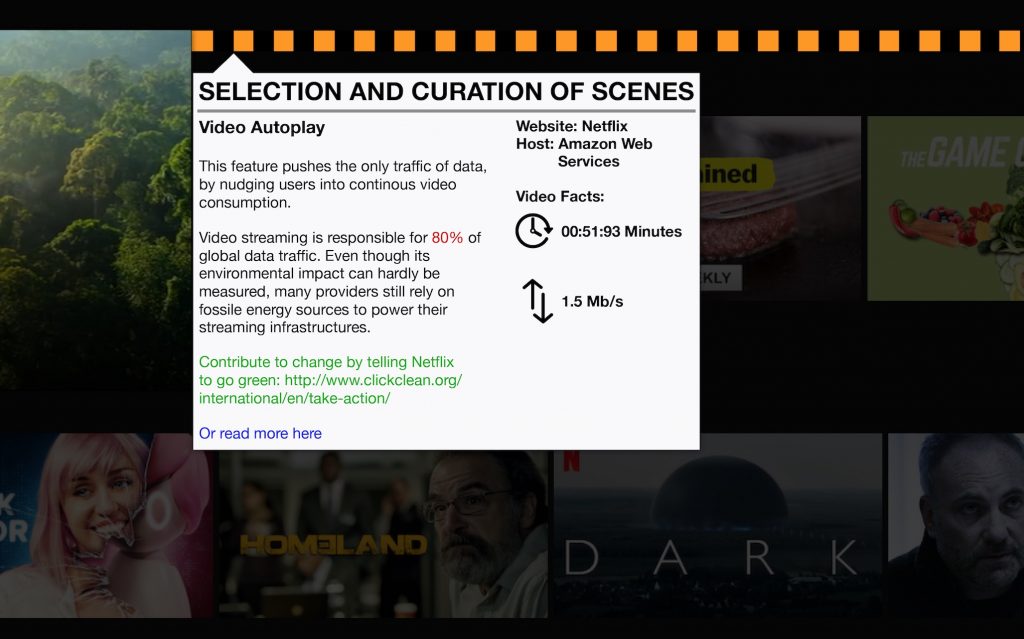
Video on Demand is another central topic covered by INFRAWARE. According to a study of the Parisian Think Tank ‘The Shift Project’, video traffic accounted for 80% of global internet traffic in 2018. Online video streaming, comprises therein 60% of these 80%, and can again be further split in 34% of Video on Demand Streaming services, such as Amazon Prime or Netflix, 27% pornographic video streams and 39% streaming on platform services such as Youtube, Facebook, Instagram, etc (Efoui-Hess 5).
Video streaming is therein the biggest environmental factor of data traffic consumption (Efoui-Hess 5; Sühlmann-Faul 32). This is due to the fact that, as in a similar stance as electricity needs to be generated in a power plant that exists remotely from the sockets in our homes, video streaming services draw on larger server structures to accommodate, share and re-distribute the large quantities of information that are needed to represent video data. Also, with increasing internet speed, the technological thresholds for streaming large amounts of video have been increasingly lowered so that nowadays video has become a commodity that can be easily distributed and shared online. This is done in the form of ads (as described previously), newly emerging video-on-demand services (Amazon Prime, Netflix, etc.), and internet video-streaming platforms such as YouTube or Vimeo.
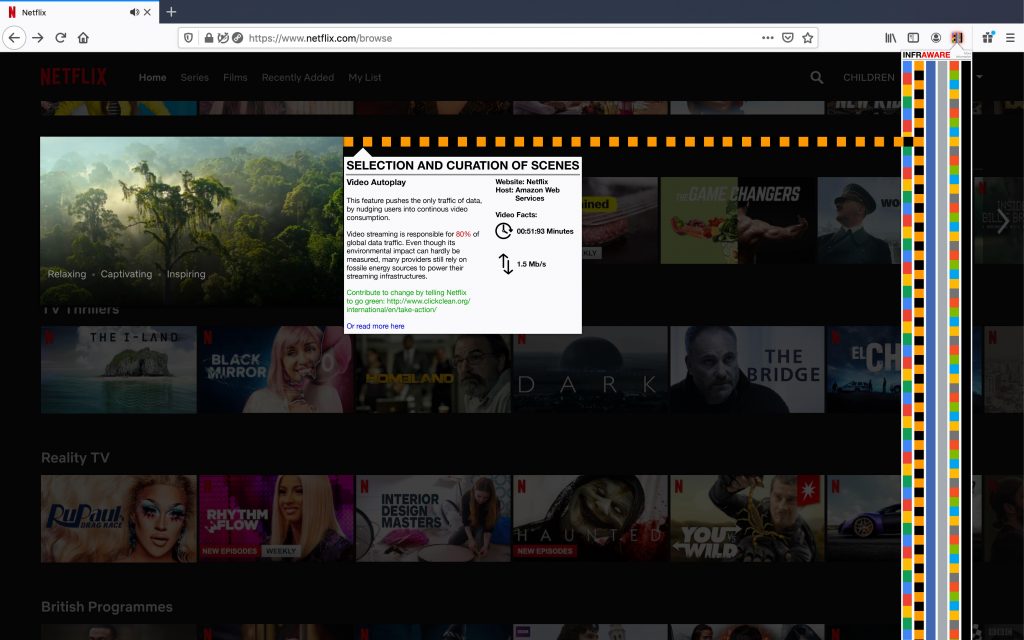
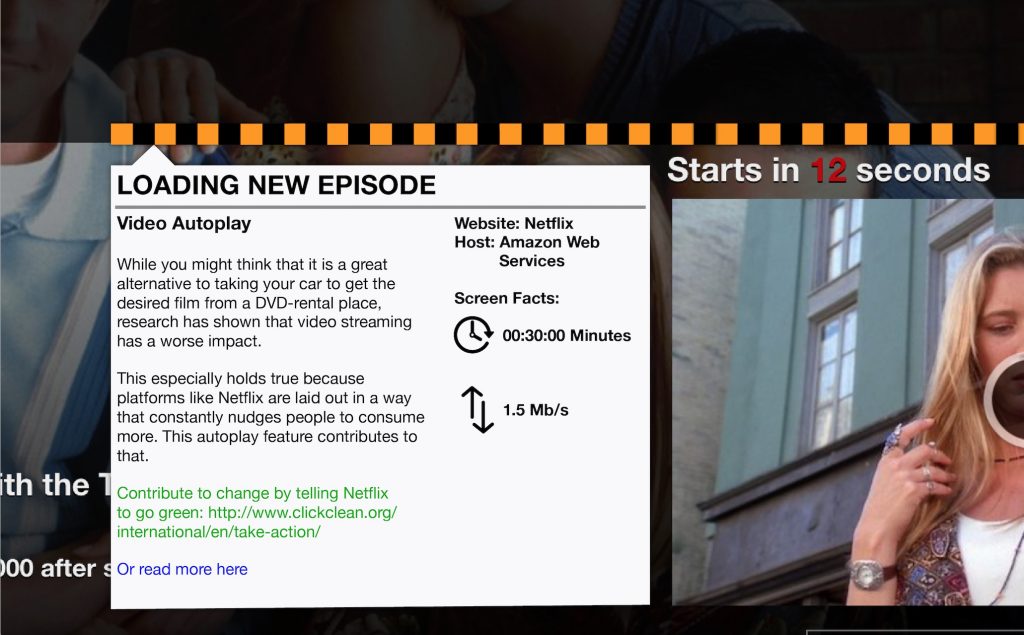
Additionally, websites and ads nudge users into continuous video consumption by immediately displaying the next episode of a series (as in the case of Netflix), or by playing video content as soon as users access the web page or scroll over it (as in the case of Facebook or Instagram). These inbuilt practices, usually designed to increase platform and content engagement, increasingly push online traffic and therefore affect the climatic and environmental conditions on the basis of which data center servers are built.
Take for example the Netflix internet entertainment service. As soon as you are logged in and launch the website or app, you are provided with a plethora of available content. However, the user experience you are provided with on Netflix might significantly differ from the user experience of other users; The service’s underlying algorithm is designed to constantly adapt to individual user input and provide a personalized content experience, addressed to user’s individual taste preferences. To achieve optimum personalization, Netflix draws from more than 76,000 micro-genres (Vinvent; Alexis), designed to categorize content and provide a tailored UX content output that triggers maximum user satisfaction. At Netflix, user experience is then further personalized by continuously changing and testing the visual content of video teaser images. It does so by algorithmically selecting and curating appealing scenes of the videos portrayed and discovering, via trial and error, which of the images shown appear most to a user’s liking, hence increasing the chance of engaging with the content displayed (Chandrashekar et al.; Barton). In both cases, multiple complex processing operations are needed for each single UX, which again increases energy consumption of the overall service. INFRAWARE then features the visualization of the traces of the energy consumed by such video platform interface features, as illustrated in our INFRAWARE wireframe for Netflix.
Besides the cases of online advertising and VOD, INFRAWARE will be open for contributions by its users, researchers and journalists. In this way, INFRAWARE can grow and potentially map ever expanding parts of internet-environment overlay from multiple perspectives.

3. Conclusion
INFRAWARE is embedded in a larger movement which is currently coming together to harness technology for sustainability and the social good. This movement is constituted from the ranks of the environmental movement and the digital rights movement. In November 2018, the Bits & Bäume conference in Berlin was dedicated specifically to uniting these two groups. Over the last year, groups such as Hackers Against Climate Change or Hackers For Future were founded. This year’s Chaos Communication Congress — Europe’s largest get-together of hackers — dedicated an entire track to technology and sustainability.
INFRAWARE is thus devised at a crucial moment in history and aims to contribute to existing efforts. Ultimately, its goal is to show that our digital rights are directly connected to environmental rights: INFRAWARE shows that we have a right to know about the underlying infrastructures of the internet — not only from the perspective of privacy, autonomy and power distribution but also because our use of technology is increasingly affecting the environment we live in and depend on.
This is the reason why we need transparency: How high is the energy consumption of an online service? What are the carbon emissions? Where do the material resources come from? Under which working conditions are my devices produced, and where? Who operates the data centers? Who collects data about me? These are all questions that INFRAWARE cannot answer today. But our hope is that it will be able to answer many of these questions through crowdsourced research and contributions in the future.
By spotlighting certain examples and attempting to make certain things more transparent, INFRAWARE can create the awareness that is needed to exert public pressure. Our experiences tell us that our economies (including the IT sector) will not change towards a more sustainable and just future voluntarily. We need obligatory regulations as incentives for change, ensuing drastic penalties if companies do not comply. This is the political project INFRAWARE aims to work towards.
Bibliography
Barton, Gina. ‘Why Your Netflix Thumbnails Change Regularly’. Vox, 21 November. 2018, https://www.vox.com/2018/11/21/18106394/why-your-netflix-thumbnail-coverart-changes.
Bleier, Alexander, and Maik Eisenbeiss. ‘Personalized Online Advertising Effectiveness: The Interplay of What, When, and Where’. Marketing Science, vol. 34, no. 5, September 2015, pp. 669–88.
Bosetta, Michael. ‘The Platform Society, Public Values, and Politics, with Dr. José van Dijck.’ Social Media and Politics. 2019. Podcast, MP3 audio. 3 October 2019. https://socialmediaandpolitics.org/the-platform-society-public-values-politics-van-dijck/.
Chandrashekar, Ashok, et al. ‘Artwork Personalization at Netflix’. Medium, 7 December 2017, https://medium.com/netflix-techblog/artwork-personalization-c589f074ad76.
Christl, Wolfie, and Sarah Spiekermann. Networks of Control: A Report on Corporate Surveillance, Digital Tracking, Big Data & Privacy. Facultas, 2016.
Cook, Gary, et al. ‘Clicking Clean: Who Is Winning the Race to Build a Green Internet?’ Greenpeace #ClickClean. 2017. GreenPeace Inc. 12 October 2019. http://www.clickclean.org/international/en/.
Dieter, Michael, and David Gauthier. ‘On the Politics of Chrono-Design: Capture, Time and the Interface’. Theory, Culture & Society, vol. 36, no. 2, March 2019, pp. 61–87.
Efoui-Hess, Maxime. Climate Crisis: The Unsustainable Use of Online Video. The Shift Project, July 2019, https://theshiftproject.org/wp-content/uploads/2019/07/2019-02.pdf.
Frick, Vivian, and Rainer Rehak. ‘Verkauftes Internet: Zur Sozial-Ökologischen Gestaltung Digitaler Räume’. Was Bits & Bäume Verbindet: Digitalisierung Nachhaltig Gestalten., edited by Anja Höfner and Vivian Frick, oekom, 2019, pp. 87–90.
Helmond, Anne. The Web as Platform: Data Flows in Social Media. University of Amsterdam, 2015.
Lanaria, Vinvent. ‘Netflix Has More Than 76,000 Micro-Genres Of Movies And TV Shows: Here’s How To Unlock Them’. New York Times, 9 January 2016, https://www.techtimes.com/articles/122723/20160109/netflix-has-more-than-76000-micro-genres-of-movies-and-tv-shows-heres-how-to-unlock-them.htm.
Madrigal, Alexis. ‘Netflix Built Its Microgenres By Staring Into The American Soul’. National Public Radio, https://text.npr.org/s.php?sId=259128268. Accessed 23 October. 2019.
Mattern, Shannon. ‘Infrastructural Tourism’. Places Journal, no. 2013, July 2013.
Morton, Timothy. Dark Ecology: For a Logic of Future Coexistence. Columbia University Press, 2016.
Pärssinen, M., et al. ‘Environmental Impact Assessment of Online Advertising’. Environmental Impact Assessment Review, vol. 73, November 2018, pp. 177–200.
Plantin, Jean-Christophe, et al. ‘Infrastructure Studies Meets Platform Studies in the Age of Google and Facebook’. New Media & Society, vol. 20, no. 1, 2016, pp. 293–310.
Star, Susan Leigh, and Geoffrey C. Bowker. ‘How to Infrastructure’. Handbook of New Media: Social Shaping and Social Consequences of ICTs, edited by Leah A. Lievrouw and Sonia Livingstone, Updated Student Edition, Sage Publications, 2006, pp. 230–45.
Sühlmann-Faul, Felix, and Rainer Rehak. ‘Die Ökologischen Auswirkungen von Videostreaming’. Was Bits & Bäume Verbindet: Digitalisierung Nachhaltig Gestalten., edited by Vivian Frick, oekom, 2019, pp. 87–90.
van Dijck, José, et al. The Platform Society. Oxford University Press, 2018.