Public Safety in the Year of Unprecedented Times: An Intervention on Government Sanctioned Covid-19 Data Visualization
As the COVID-19 pandemic continues to spread globally, most governments have launched national ‘corona dashboards’ via public health organisations on which they keep track of the (rising) case numbers and attempt to visualize the spread of the virus in numerous data visualizations. Since these are publicly accessible—and have been distributed throughout different media outlets such as Twitter threads (Trajkova et al.), newspapers, and edited by data journalists (Leach and Swann; The New York Times; Het Parool; TVN24)—there’s likely a large audience consuming this media who may not be ‘data literate’ (Alberda). Considering most nations are either in, or reentering, lockdown, the global majority of people are obtaining their information through these mediated environments, but may not possess the tools to critically examine what is being expressed in these datavis.
In what follows, we will assess the various ways in which governments’ health organisations depict the spread of the virus, while also emphasizing the importance of contextualized data visualizations. By focusing on corona dashboards of four different countries—The Netherlands, Poland, The United Kingdom, and The United States—we will explore how national health organizations are using data visualization to inform their residents about coronavirus cases and spread. With these case studies as examples, we offer strategies the general public can use to critically engage with the data they consume, in an effort to mitigate the spread of coronavirus misinformation.
The importance of data visualizations (during a pandemic)
Access to information is key to developing strategies to combat the spread of the virus, however, there lies a risk in the uncontrolled, decontextualized spread of covid data visualizations in the public sphere (Bowe et al. 1-2). First, the covid datasets are never complete because (1) not everyone with symptoms gets tested; (2) not everyone who’s infected has symptoms; and (3) new data is added to the datasets “at an hourly rate” (Chase; Bowe et al. 2). Also, since the pandemic is ongoing, even if all these variables were measured accurately it would still not be complete since the data will continue to increase while the pandemic still spreads. As a result, there are no visualizations that can fully, accurately, depict all coronavirus information.
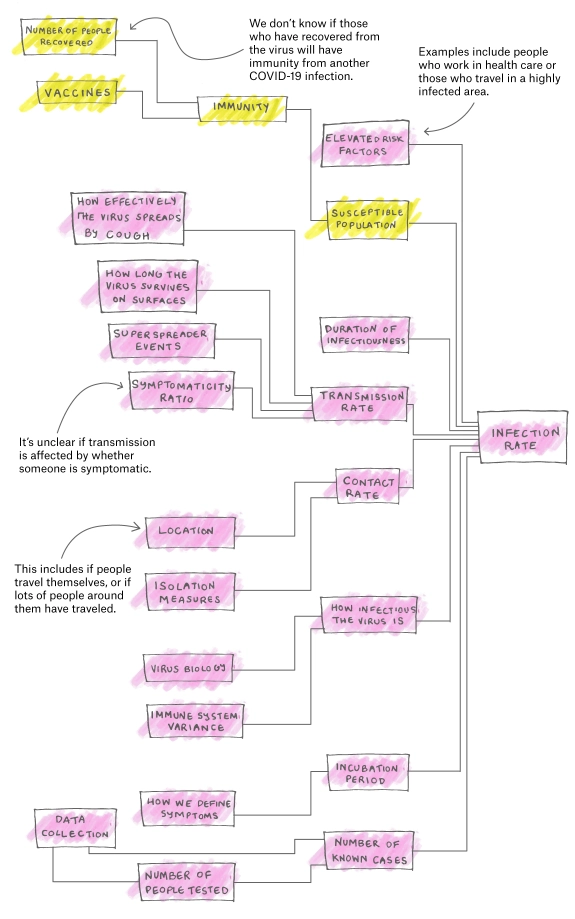
Koerth et al. further highlights the difficulty involved in making COVID data visualizations. The numbers utilized to make these visualizations are “all over the place,” since the mathematical models used to calculate the exact numbers are fed with complex variables (Koerth et al.). Additionally, numbers visualization is only as good as the quality of the data. They attempt to explain this in Figure 1 by showing the steps—and uncertainty—involved in generating a standardized variable such as infection rate for a coronavirus data graphic (Koerth et al.).
Furthermore, people are biased when interpreting these visualizations. People’s concerns—from health and safety to infringement of personal ‘freedom’ (Romano)—influence how they interact with data and may engage in cognitive dissonance, where they only focus on data that aligns with their situation and beliefs (Festinger). To mitigate misinterpretation, then, datavis need to be clearly contextualized.
An example of how presenting statistics out of context can lead to data misinterpretation was demonstrated on a Polish news broadcasting company TVN24 (qtd. in Stefczyk.info):
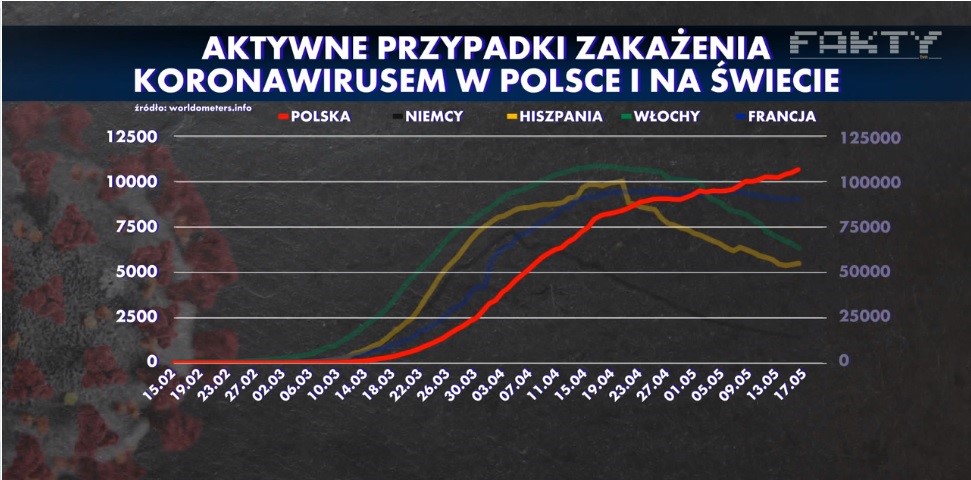
This graph depicts infection curves for Poland (red), Germany (black), Spain (yellow), Italy (green) and France (blue) between February and May 2020. Its purpose was to compare the rising curve of infections in Poland against the declining curves of the most affected European countries during that period. However, unbeknownst to viewers, the Polish curve was copied from a different graph, displaying the rising curve of infections in Poland next to different values, and pasted directly, without adjusting the size of the curve to match the numbers. As a result, the graph implies that the number of infections in Poland surpassed the other countries around early May, which never happened in reality.
Overall, these literature demonstrate the difficulty involved in generating coronavirus datavis, that this difficulty explains the variation in coronavirus datavis, and also why striving for accurate visualizations is important in a pandemic age.
METHODOLOGY
We chose these countries because The Netherlands, the U.K., and the U.S. currently possess some of the world’s highest positive test rates (WHO); furthermore, we each represent one of these countries in our nationalities and, being familiar with the public discourse surrounding the numbers, can utilize an emic approach to these phenomena. To find similarities among the visualizations of the chosen countries, we selected four shared variables that each country had visually represented: (1) death statistics, (2) the dispersion of covid, (3) current cases and (4) the reproduction number (R0). As some governments’ corona dashboards are more vast than others, we are focusing on graphs that each health organization has published on their website, to assess how they visualize their available data differently in their attempts to communicate the scope of the pandemic within their communities.
ANALYSIS
The Dutch coronavirus graphs and dashboard
The Dutch government has two main locations for their data visualizations of the coronavirus spread: the RIVM (the government’s public health organization) and the coronavirus dashboard. On the RIVM, the government keeps track of the daily cases, number of hospitalized people and death number—all data is put in graphs that show a rise or decline in numbers. The tracking started on 27 February 2020 and was transferred into a new graph on 6 July.
Meanwhile, the coronavirus dashboard shows the risk of the virus in certain regions of the country. There they also display the distribution of confirmed cases and medical indicators, such as the reproduction number. The case numbers are measured daily, but are sometimes adjusted when test results are delayed or when they have to be corrected (RIVM). The Dutch government also adds a disclaimer to its representation of numbers: they write that the numbers are “possibly higher” because not everyone who is infected gets tested (RIVM). The government also provides a full methods section and the complete, daily updated dataset of the current numbers on a separate web page (RIVM).
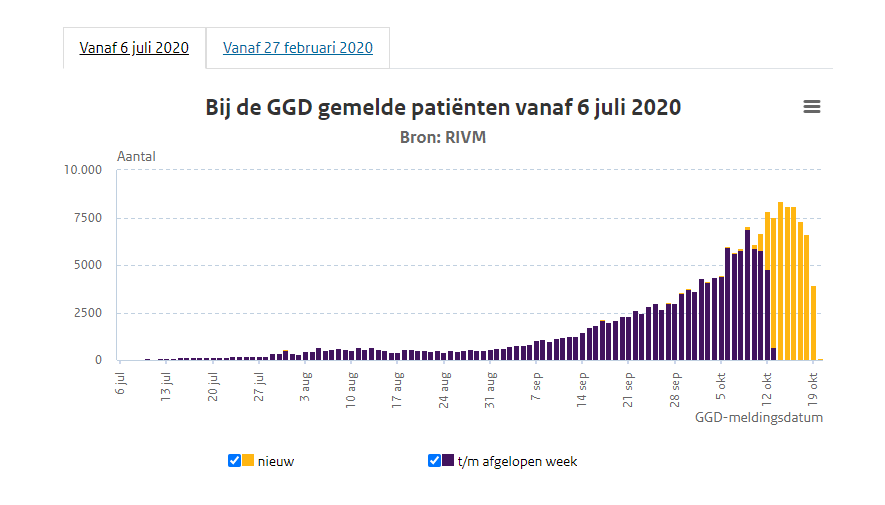
The graph above displays the number of current cases in the Netherlands. The Y-axis shows the number of cases; on the X-axis, which is divided in weeks, one can easily see the decline or rise in numbers. The yellow bars, then, display the new cases per week, or a correction of the numbers of the week or day before were not added yet; blue displays the number of cases “including last week”. One can hover over the bars with their mouse to see the (new) case numbers. By using colors, there is separation between pending and definitive numbers; the bars or the text on the website do not explain what the blue bar, “including last week”, actually means and how or how it is measured.
The number of deaths is accounted for in the same manner as in the graph above and utilizes the same visualization. The government also adds a disclaimer to the data in this graph: sometimes, it is not known if someone died of corona if they were not tested; furthermore, sometimes the date of death is not known and thus not included in the graphs.
Coronavirus Dashboard
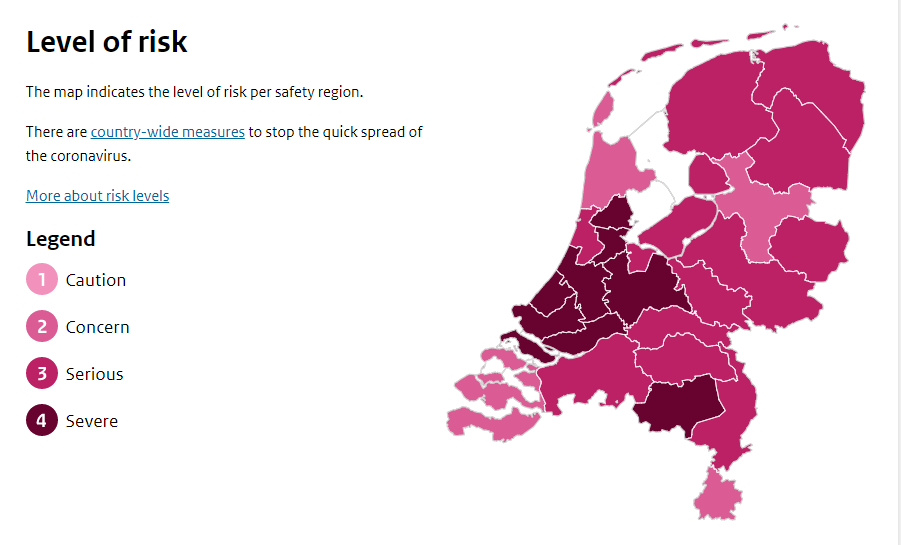
On the corona dashboard, the Dutch government divides the country into colorized regions of risk. By formulating what these indicators mean on a separate page, they show how they colorized and measured the regions’ risks. Furthermore, on this page they quickly explain the current week’s situation in terms of infection numbers, and how fast (or not) these numbers are growing.
On the right-hand corner of the page the corona dashboard also includes the R0. Using red and green, the bar indicates which reproduction number is still controllable, and when the number is harmful. One can click on the variable to understand what the R0 exactly means, how it is measured and why it is important to keep it as low as possible.
Poland: Gov.pl and International Sources
The Polish government provides citizens with one central website featuring an interface split into sections covering a) Poland b) the world. This segmentation allows an immediate and detailed comparison of figures between Poland and any other country, as well as the world collectively. The website (Gov.pl) features a central display with four statistical values (current infections, recoveries, deaths and total infections since March 4th) available to select between results concerning Poland or, collectively, the world.
Gov.pl website treats on a clear and readable interface with limited number of statistical displays such as graphs or heat maps in order not to confuse the reader. Instead, the creators of the website follow the third principle of Tufte’s list, “show data variation, not design variation” (60). Each section, Polish and global, features their own heat map showing the relevant region with all areas covered in different colours, depending on the number of coronavirus cases:
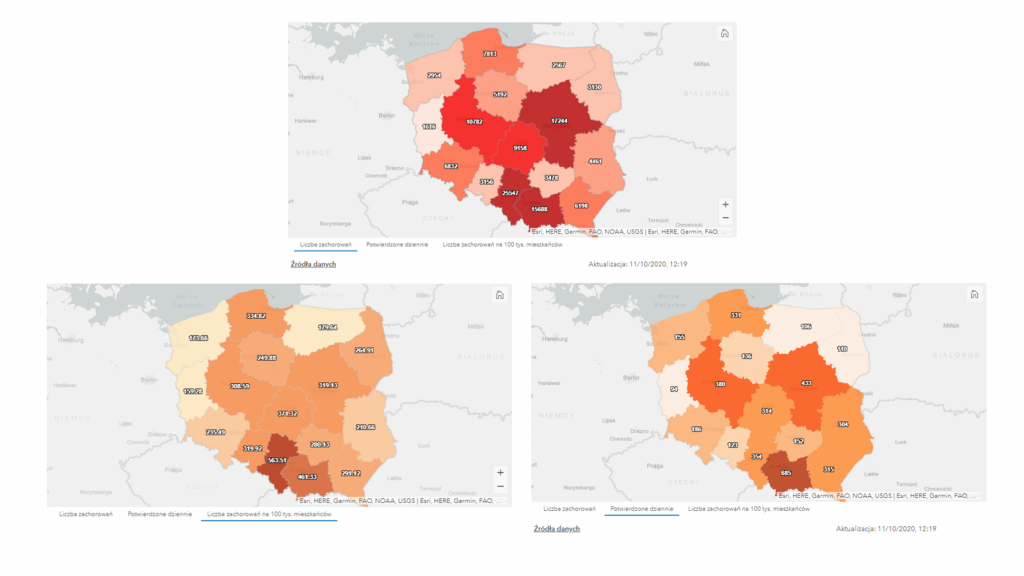
Instead of showing a different map per different variable, which would undoubtedly result in a number of maps difficult to process, the website uses the same map which allows the users to change variables. By one click of a button, the user can navigate between data showing the total number of infections, daily number of infections, or the number of infections per 100,000 inhabitants.
The global map featured on Gov.pl website provides insight into the general statistics of every country with available data. Users can navigate around the world map and select any country with available information to see the number of current cases, deceases, recoveries and the active number of cases present in this country. Gov.pl features a clear and readable layout encouraging interaction between users and the interface. The context behind the data is explained and the source (WHO) is provided next to every figure.
UK Government misinformation: comparison between UK.gov and the NHS websites
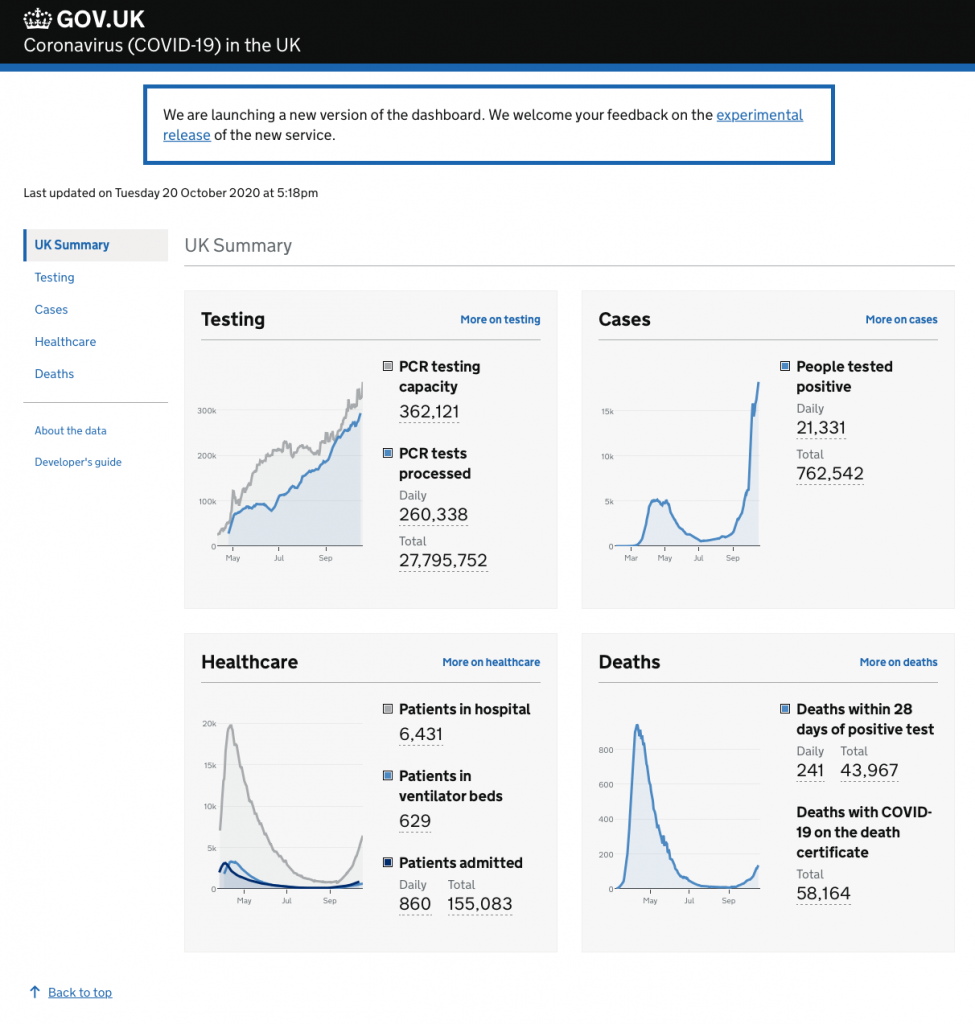
The Coronavirus dashboard data as represented on the UK Gov.uk website is split into four categories: Testing, Cases, Healthcare and Deaths. These are all presented within the ‘UK Summary’ page, where it is possible to see initial graphs and statistics of the four areas. Within each of the four sections is the option to go more in depth, with further statistics, graphs and information. There is also an interactive element; whereby hovering the mouse over a specific part of the data, the user can see particular statistics for the specific day/place with the added option of viewing the data by Nation (separate figures for England, Scotland, Northern Ireland and Wales) or the UK as a total.
These datasets are updated daily and abide by Tufte’s principles (2001) as they represent numbers in a clear and detailed way within the context of the information they are aiming to provide. What is arguably missing from these datasets provided by the UK government is a world view where a user can compare the UK. Which could perhaps be due to the fact that the UK ranks 5th in the world on deaths per 100,000 people. (By The Visual and Data Journalism Team BBC News)
The National Health Service in the UK has taken a different approach than the UK Gov.uk page. It does not offer any statistics or graphs like the government site, instead it only offers practical information on dealing with certain aspects of life with Covid; such as information on tracking and tracing, etc. The significant lack of charts/statistics is possibly due to a reassuring factor, they may want to be perceived by the audience as in control of the situation instead of adding panic and fear.

The UK Gov.uk and NHS pages are presented in a clear and relevant way in accordance with the goals they are aiming to achieve. These are the following: The Gov.uk page to clarify the situation on the statistics and damages caused by the virus. Whereas, the NHS offers answers to practical questions on day-to-day issues concerning the pandemic.
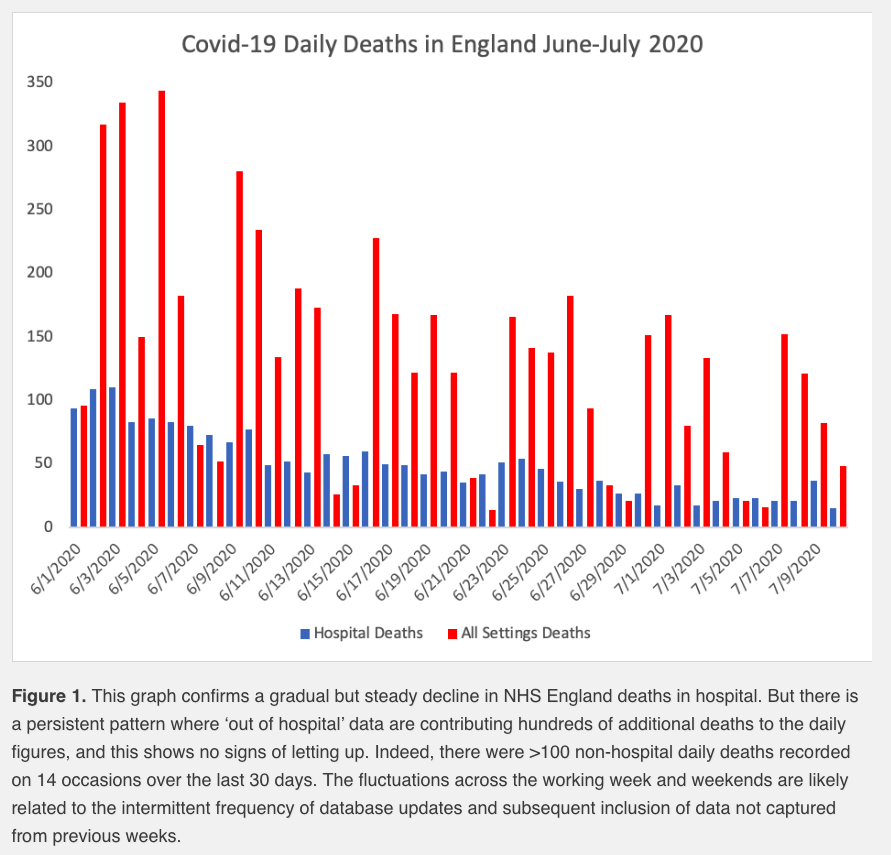
However, the problem is that only a minority of people will see this data from Gov.uk and the NHS respectively. The majority of citizens in the UK see newspaper articles and tabloids which often spread fear and misinformation, i.e fake news. A massive amount of fear and panic has stemmed from misinformation carried by the UK government. An example to illustrate this being official figures seeming to overstate England’s actual death toll. It was found out that the Public Health England’s (PHE) checked the NHS database to see those who have tested positive for Coronavirus and would only check if they were alive or deceased. As a result, someone may have tested for Covid-19 and fully recovered after successful treatment, only to be hit by a bus two or three months later and be classified as having died from the virus. (Loke and Heneghan, 2020.) This detail is the reason why in the UK there was an extreme number of corona deaths that had been overstated, causing a great deal of fear and panic. Shown by ‘out of hospital setting’ deaths for corona were extremely high for prolonged periods of time whereas ‘hospital deaths’ has remained the same. As shown in the graph below taken from January to July this year.
United States heat maps and home page
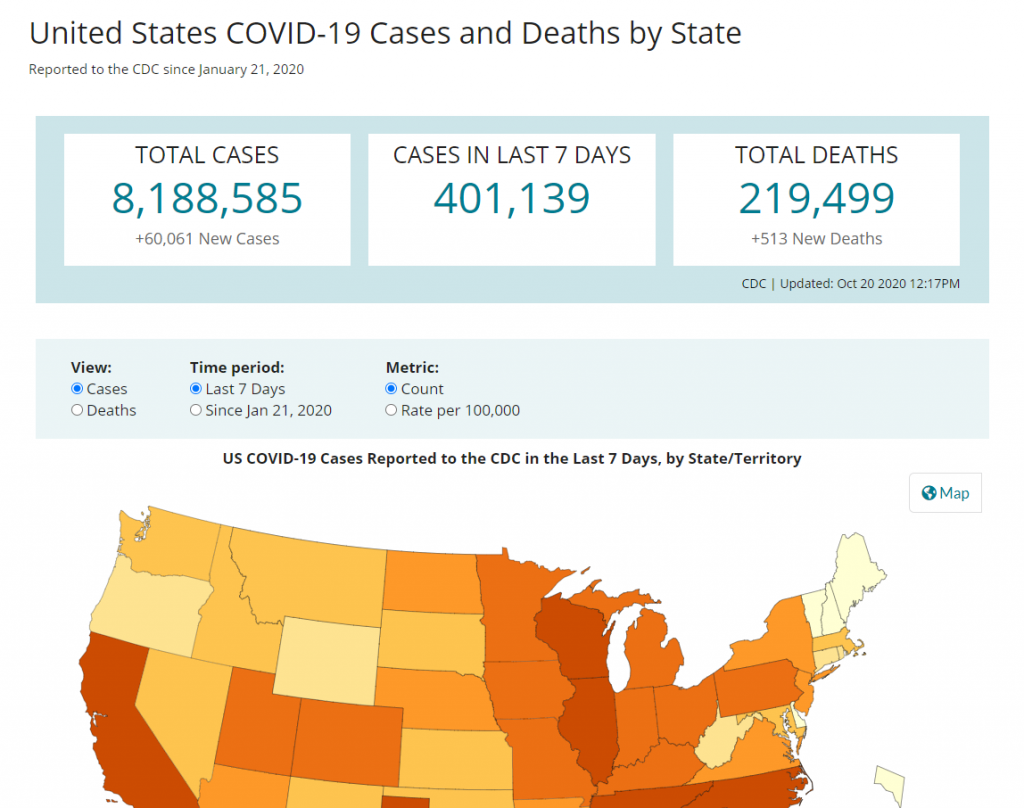
The CDC’s big data approach to covid-19 information reflects the United States’ ‘global leader’ ideal. The information provided is extensive—such as detailing updates about the country as a whole, states on individual levels, wellness of healthcare workers, and vulnerable populations—and invites users to download full data sets to make their own visualizations. However, only the default COVID Data Tracker page—the “Cases and Deaths by State” section under the “Case Trends” tab—will be discussed, since it contains the overarching updates about national (and state specific) covid cases, deaths, and spread.
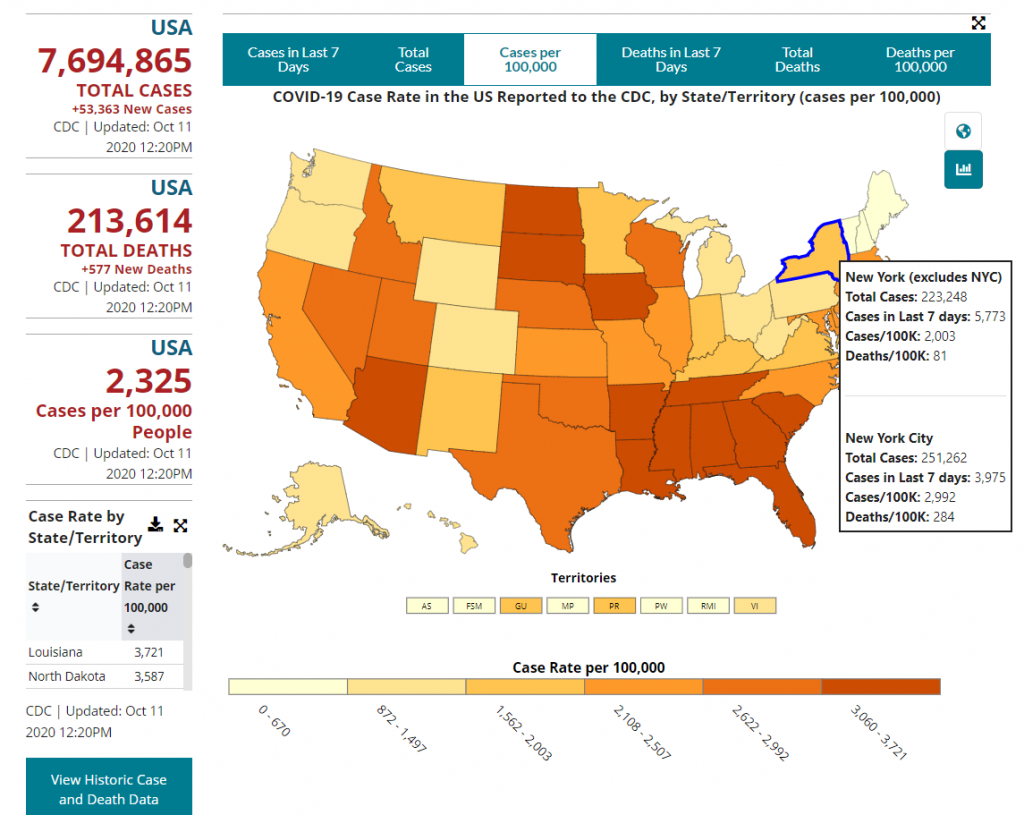
As shown above, the page is visually crowded. There is more data being discussed than is visually depicted in the Case Rate per 100,000 heat map. It’s difficult to discern whether the numbers in the left column relate to the color gradient on the map—they don’t—and the format crowds data in an overwhelming manner.
The data is further confounded by the tooltip generated when the cursor highlights a state—there’s more data variables listed than are visualized on the heat map. Putting the information from each of the six heat maps in one place is convenient, but this interface makes it difficult to parse which number the color intensity is supposed to represent. There is a title and map key to indicate which data is currently being visualized, but website’s interface emphasizes the overlaid tooltip generated at the cursor, since its: 1) placed where users are currently looking; and 2) bolded, isolated, and contained in a way that makes it more noticeable.
Most importantly, the homepage excludes information that contextualizes the difference in corona spread between states. Examples of necessary information include: the total population of each state, distribution of cases in rural vs urban environments, whether quarantine laws have been enforced or unenforced, demographics of which populations have been targeted, etc. This context is crucial for understanding the spread of the virus, without it, it becomes difficult for prone populations to assess their safety and for people to develop strategies to combat its spread in general. During our research, the COVID Data Tracker page underwent significant design change, moving the overarching statistics to the top of the page and situating the heat map in its own section (Figure 10). These adjustments illustrate that the previous design was difficult for people to interpret and required formatting changes to help increase graphical literacy.
CONCLUSION
These case studies outline the various strategies governments have utilized in attempt to visualize coronavirus information. The graphs would mean a lot more if the precise number of cases was fully known. Without the correct case numbers, the mortality rate cannot be known (Chase). An example from the UK is where thousands of deaths were being recorded classified as corona deaths even if the patient had fully recovered, before dying from a completely unrelated cause months later. (Locke and Heneghan). This adds to the fact that the number of deaths is often unknown or even completely wrong– without a clear metric and a pervasive testing policy, the number of covid deaths can never be fully grasped.
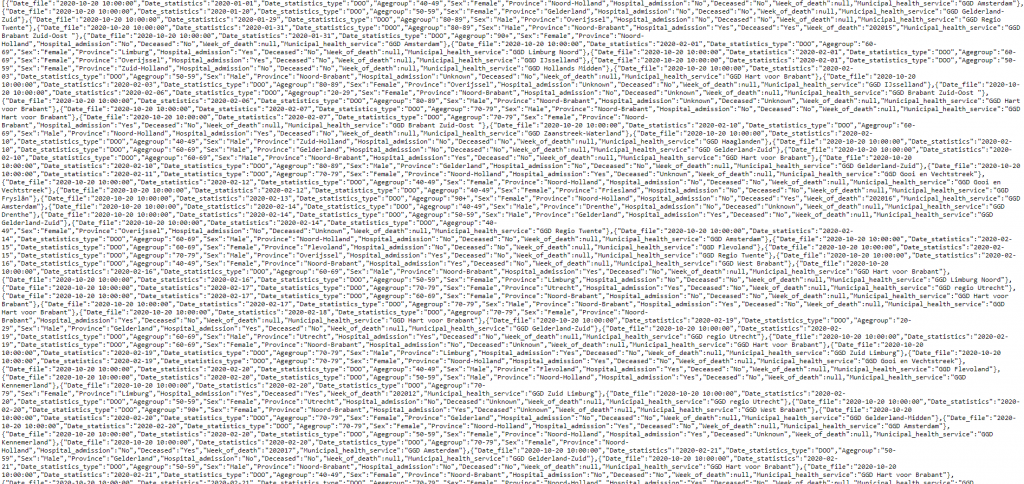
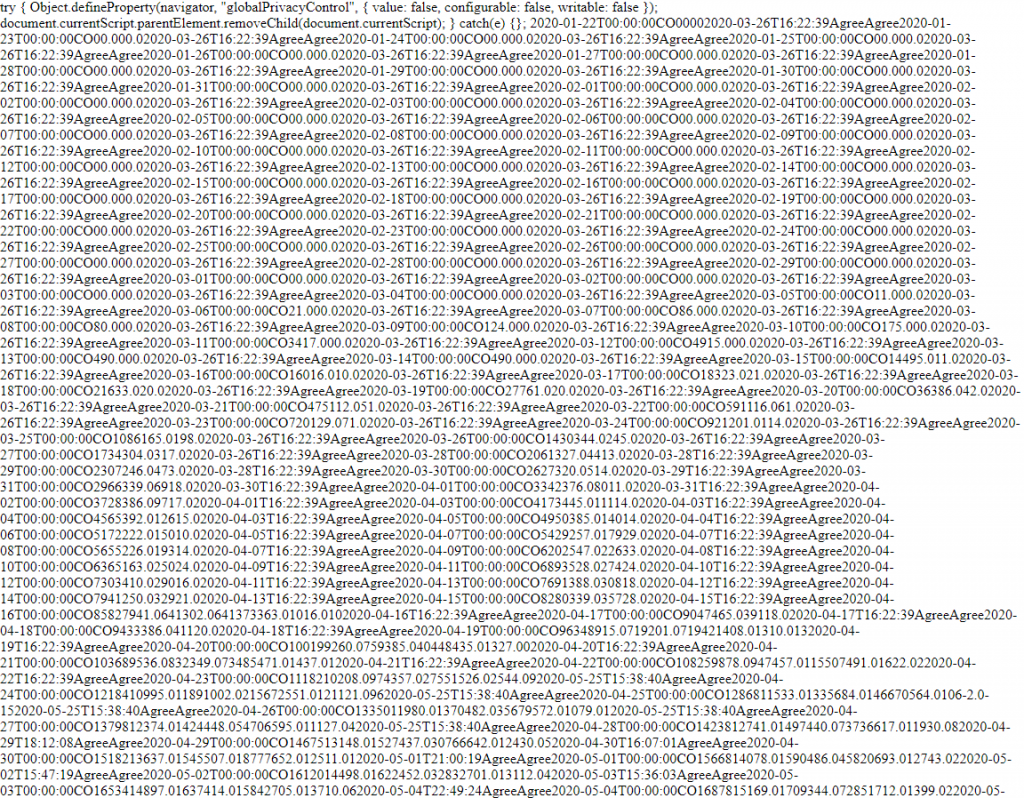
In order to further emphasise the importance of contextualized data visualizations, we show in this part of the intervention, the datasets of the different countries—that allow downloads of their datasets—as they were before they were shown within a broader context and translated into graphs. With the numbers only, it is not clear at all how the numbers are changing; where the people are most at risk; how many people die in total and how the cases are spread across a country.
Works Cited
Alberda, Alexandra P. ‘COVID-19 Data Literacy Is for Everyone’. Medium, 5 May 2020, https://medium.com/nightingale/covid-19-data-literacy-is-for-everyone-46120b58cec9.
Bowe, Emily, et al. ‘Learning from Lines: Critical COVID Data Visualizations and the Quarantine Quotidian’. Big Data & Society, vol. 7, no. 2, July 2020, p. 205395172093923. DOI.org (Crossref), doi:10.1177/2053951720939236.
Boyd, Danah, and Kate Crawford. ‘CRITICAL QUESTIONS FOR BIG DATA: Provocations for a Cultural, Technological, and Scholarly Phenomenon’. Information, Communication & Society, vol. 15, no. 5, June 2012, pp. 662–79. DOI.org (Crossref), doi:10.1080/1369118X.2012.678878.
CDC. “Coronavirus Disease 2019 (COVID-19) in the U.S.” Centers for Disease Control and Prevention, 28 Mar. 2020, https://covid.cdc.gov/covid-data-tracker.
Chase, William. ‘Why I’m not making COVID19 visualizations, and why you (probably) shouldn’t either’. Williamrchase, 31 March 2020, www.williamrchase.com/post/why-i-m-not-making-covid19-visualizations-and-why-you-probably-shouldn-t-either/. Accessed 17 Oct. 2020.
Covid in the U.S.: Latest Map and Case Count. | The New York Times, 20 July 2020. www.nytimes.com/interactive/2020/us/coronavirus-us-cases.html. Accessed 17 Oct. 2020
Covid-19 Pandemic: Tracking the Global Coronavirus Outbreak – BBC News. https://www.bbc.com/news/world-51235105. Accessed 21 Oct. 2020.
Festinger, Leon. A Theory of Cognitive Dissonance. Tavistock, 1962.
Het Coronavirus in Nederland Op de Kaart, in Cijfers En Grafieken | Het Parool. www.parool.nl/nederland/het-coronavirus-in-nederland-op-de-kaart-in-cijfers-en-grafieken~b0ff746f/. Accessed 17 Oct. 2020.
Koerth, Maggie, Laura Bronner and Jasmine Mithani. ‘Why It’s So Freaking Hard To Make A Good COVID-19 Model’. FiveThirtyEight, 31 Mar. 2020, https://fivethirtyeight.com/features/why-its-so-freaking-hard-to-make-a-good-covid-19-model/.
Leach, Anna, et al. ‘Who Does Coronavirus Kill in England and Wales? Visualising the Data’. The Guardian, https://www.theguardian.com/world/ng-interactive/2020/jun/11/who-does-coronavirus-kill-in-england-and-wales-visualising-the-data. Accessed 17 Oct. 2020.
Loke and Henegan. (2020 “Why No-One Can Ever Recover From COVID-19 In England – A Statistical Anomaly – CEBM”. CEBM, 2020, https://www.cebm.net/covid-19/why-no-one-can-ever-recover-from-covid-19-in-england-a-statistical-anomaly/.
Mapa Zarażeń Koronawirusem. Serwis Rzeczypospolitej Polskiej, 2020, https://www.gov.pl/web/koronawirus/wykaz-zarazen-koronawirusem-sars-cov-2
Ministerie van Volksgezondheid, Welzijn en Sport. Dashboard Coronavirus COVID-19 | Government.nl. https://coronadashboard.government.nl. Accessed 20 Oct. 2020.
RIVM. Ontwikkeling COVID-19 in Grafieken | RIVM. https://www.rivm.nl/coronavirus-covid-19/grafieken. Accessed 17 Oct. 2020.
Romano, Aja. ‘Nearly a Third of Americans Believe a Conspiracy Theory about the Origins of the Coronavirus’. Vox, 12 Apr. 2020, www.vox.com/covid-19-coronavirus-us-response-trump/2020/4/12/21217646/pew-study-coronavirus-origins-conspiracy-theory-media.
Trajkova, Milka, et al. ‘Exploring Casual COVID-19 Data Visualizations on Twitter: Topics and Challenges’. Informatics, vol. 7, no. 3, Sept. 2020, p. 35. DOI.org (Crossref), doi:10.3390/informatics7030035.
Tufte, Edward. ‘Part 1: Graphical Practice’. The Visual Display of Quantitative Information, Second Edition, Graphics Press LLC, 2001, pp. 13–87.
Tapsfield, James. (2020) “Blame Game After 16,000 Covid Cases Missed Due To Excel Glitch”. Mail Online. https://www.dailymail.co.uk/news/article-8805697/Furious-blame-game-16-000-Covid-cases-missed-Excel-glitch.html.
“Ujawniamy: Tak manipuluje TVN24. Aż trudno w to uwierzyć!” Stefczyk.info, https://www.stefczyk.info/2020/05/22/ujawniamy-tak-manipuluje-tvn24-az-trudno-w-to-uwierzyc/. Accessed 12 Oct. 2020.WHO Coronavirus Disease (COVID-19) Dashboard | WHO Coronavirus Disease (COVID-19) Dashboard. https://covid19.who.int/. Accessed 20 Oct. 2020.