Information Visualization and Conflict
The visualization of information has long been a tool for generals and historians alike to go over military strategy and to materialize the concomitants of battle. As military operations continue within an increasingly data-rich environment, we must ask if more can’t be done to implement and improve upon the tools that may have the power to aid in conflict resolution. The use of infographics in the past has shed a lot of light on the reasons why even the best laid plans have failed and the valuable lessons gleaned from their creation has powered the creation of what should have been a more efficient war machine. In this post we will explore the successes of past conflict-inspired infographics and the role of information visualization in conflict interpretation and resolution today.

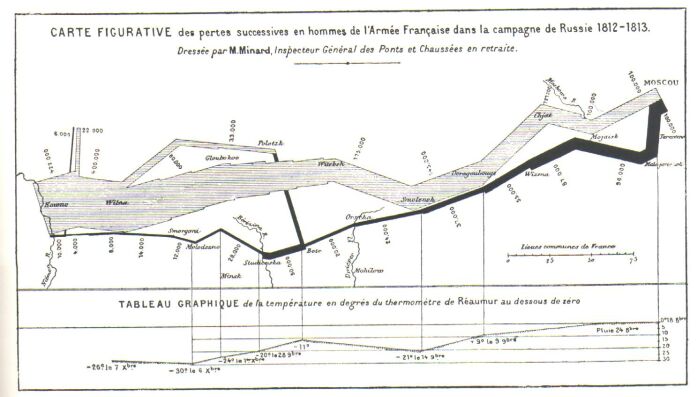
One of the most famous references to the beginnings of information visualization that is used over and over again is Charles Joseph Minard’s Carte figurative des pertes successives en hommes de l’Armée Française dans la campagne de Russie 1812-1813 which represents the losses suffered by Napoleon’s army during the invasion of and subsequent retreat from Russia, the general direction the troops took, and the average temperatures during each portion of the campaign. This early infographic has often been labeled the “best statistical graphic ever” by the statistician and information design scholar, Edward Tufte, among others. In his book, Beautiful Evidence, Tufte uses Minard’s work to help illustrate his “Fundamental Principles of Analytical Design”:
1. Show comparisons, contrasts, differences
2. Show Casuality
3. Multivariate Analysis
4. Show Evidence
5. Document everything
Minard’s efforts in his infamous infographic clearly satisfy the five principles listed above. Minard’s work was also groundbreaking in his day for his uniquely multivariate style; a style that has become easy to emulate today with the use of the intuitive interfaces offered to us by highly customizable programs such as Swivel, and Google Maps.
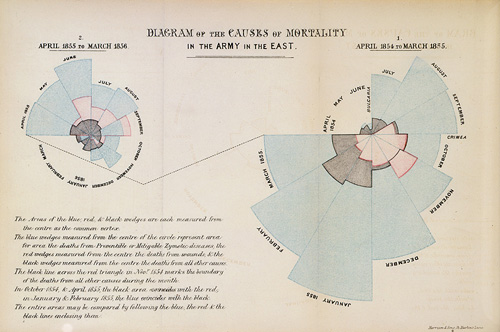
Another interesting infographic from around the same time period as Minard’s and which follows many of Tufte’s principles is Florence Nightingale’s now famous coxcomb diagrams. These diagrams were created to show the ridiculously high numbers of deaths that were occurring during the Crimean War due to preventable and communicable diseases as opposed to the relatively low numbers of soldiers dying as a result of their combat injuries. Nightingale used her infographics to highlight the poor sanitation conditions and practices that plagued the infirmaries established and to prove definitively that the armies themselves were their own greatest enemy.
Otto Neurath, famed founder of the Isotype Institute, also contributed significantly to the use of visualization techniques in periods of war. Through the isotype picture language that he had helped develop along with Marie Reidemeister, Neurath translated complicated data into easily readable pictograms. Due to his experience in analyzing political and wartime economy, Neurath was well suited to see which areas of wartime activity needed to be communicated to the populace. Over the years at both the Gesellschafts- und Wirtschaftsmuseum in Vienna and the Isotype Institute, Neurath and his colleagues developed effective methods of visualizing the costs that past wars had had on society, particularly World War I, and later, along with Paul Rotha, created films that would stress the importance of the conscious use and recycling of materials in order to support the allied war effort during World War II.
Since the development of Neurath’s isotype it has played a recurrent role in the calculation of the great economic and personal costs that conflicts have incurred over the years. The rise of the digital age has seen new developments in the analysis of these costs of conflict on a more interactive and engaging scale. The most recent conflicts to be evaluated in this way are the wars in Iraq and Afghanistan which have been going on since 2003 and 2001, respectively. Two of the most impressive visualizations are The New York Times’ “Casualties of War” and “Map the Fallen,” an independent project created by Sean Askay, Google employee and Google Earth Outreach specialist in educating non-profits on how to visualize dense spatio-temporal data sets using Google software. “Casualties of War” focuses on the Iraq War and analyzes death tolls by age, race, branch of military and type of duty. The deaths are placed on a timeline and broken down by province in which they took place and home states from which the deceased originated. “Maps the Fallen” takes a much more personal approach to both the Iraq and Afghanistan conflicts. Each casualty is plotted on Google Earth using an overlay. The markers can be identified easily by gender and upon exploring the markers information such as name, age and cause of death can be determined. For each marker representing a casualty a corresponding marker pinpoints that person’s hometown. These visualizations help put the losses of war into perspective as they bring the events occurring in a geographically isolated region closer to home.
But to what extent has visualization worked towards resolving the conflicts in the Middle East? A recent article in The New York Times elaborated on the issues the army was having internally with its attempts to visualize the challenges it faced in establishing lasting peace in Afghanistan. Although the article focused mostly on the military’s over-use of Powerpoint, blaming the reliance on the Microsoft Office product for creating an “illusion of understanding and illusion of control” (Bumiller 2010), one particular slide, meant to illustrate the complexity of the American mission in Afghanistan, received a lot of media attention. The mangled, spaghetti mess meant is meant to show all the challenges facing the Allied troops but it’s poor design makes the biggest obstacle actually deciphering the diagram. Since then the Fachhochschule Potsdam has created a much more straightforward, flowing map, simply called “The Afghan Conflict,” which presents every calculated eventuality of the Allied troops future actions. Even though this project doesn’t necessarily fulfill Tufte’s principles of analytical design
Although the negativity of war can be a consuming endeavor to visualize for those opposed to its consequences (especially with death being its most tangible result), the field of visualization should be employed more often as a means of discovering solutions as Florence Nightingale did during the Crimean War. And, even if times of conflict aren’t known for being boons of data transparency, greater efforts need to be made to evaluate the real costs of conflict to present real solutions.
UPDATE: CNN has created its own impressive Iraq/Afghanistan casualty visualization. Check it out HERE!
Bonus Material:
Check out this fantastic visualization created in processing depicting the evolution of the four largest maritime empires. Any shaking or colliding of the bubbles represents some kind of conflict or colonial battle for independence.
Bumiller, E. (2010). We have Met the enemy and he is powerpoint. The New York Times, Retrieved from http://www.nytimes.com/2010/04/27/world/27powerpoint.html
Tufte, E. (2006). Beautiful evidence. Cheshire, CT: Graphics Press.
