Our need for track and trace
When we think of Maps, we are prone to think of a visual, detailed and accurate representation of an area. Our most common idea of maps is that they serve the purpose of depicting geography, we may think particularly about cartography and topography.
Maps are one of the ways we have been using since the Bronze Age, to make sense of the world around us and maybe for you and me, they serve just the purpose of a route planner: a tool that allows us to know how to plan and go from A to B.
But, maps have been used not only to depict the world, they have been used to visualize strategic plots, they have been used also with an agenda, to exert power over parts of the world, to deceive, they also have been used to offer specific perspectives to subjective experiences, they have been used as tools to advocate ideas, to raise awareness, to tell stories, to understand relationships, to expose psychogeographies. Like Professor Jerry Brotton from Queen Mary, University of London, mentioned recently [1]: “Maps give an insight into the political and cultural forces that drive Society”.
In 1967, Foucault refers on his text “Of Other Spaces” that “our epoch is one in which space takes for us the form of relations among sites”, “We are in the epoch of simultaneity: we are in the epoch of juxtaposition, the epoch of near and far, of the side by side, of the dispersed. We are at a moment when the world is experienced, I believe, less as a long life developing through time than that of a network that connects points and intersects with its own skein.”
In fact our need of visualizing is so great, seems such a basic human instinct, that as soon as we started to explore other territories, as soon as we moved from our already charted spaces onto Foucault’s “Other Spaces”, Heterotopias, such as MUDs like Ultima Online and Virtual worlds, the Cyberspace, we have felt once again the need of translating our adventures onto perceptible landscapes.
Now available for download, The Atlas of Cyberspace by Martin Dodge and Rob Kitchin, is an atlas “of maps and graphic representations of the geographies of the new electronic territories of the Internet, the World-Wide Web and other emerging Cyberspaces” and it was the first attempt, back in 2001, to comprehensively gather and explore the visual nature of cyberspace.
Foucault’s words have, in my opinion, a greater echo today because more and more our experience of the world is that of a network which connects points and elements.
Today we have at our disposal countless social applications that allow us to establish connections and relationships. At the same time we also have the means to visualize those relations; on top of this we have seen to the explosion of webmapping applications such as Google Maps or Bing Maps who’s APIs enable myriads of new cartographies.
But if representing by visual means is such an instinctive need to communicate, what happens when tools appear that allow us to track and trace each and every one of our most mundane activities?
Has there ever been a time in which our need to track, trace and visualize was so imperative as it is today? We are excelling in tracking and tracing, but are we having the correspondent ability and availability to visualize it?
We have become increasingly entangled in a world where everything is virtually possible to map.
So what happens when a basic human instinct gets boosted by technology? We map everything!
Mapping Everything
One of the greatest challenges of map creators was location, more specifically to find a solution to the problem of accurately measuring and mapping large areas across the globe. Longitude was still a problem without solution around the early XVII century.
With the aid of satellites we have other quests now; we are mapping other aspects of the earth, for instance issues like the earth’s melting ice.
And with the help of webmapping tools other inevitable dimensions seems to have risen: adding yourself to the map, and its counterpart, being aware of the risks of over-sharing.
Lars Rasmussen, one of the creators of Google Maps, mentioned last year at a talk on Inventing Google Maps that even though Google Maps has been live since 2005 there is the sense that the Google Maps team is just getting started “on its mission of mapping the world, or rather of organizing the worlds’ information geographically.”
This may seem a rather pretentious state but since the surveying work of appending geographic data is mostly being crowdsourced, we all are the contemporary surveyors of contemporary cartographies; it may not be an overstatement that Google, with a little help from millions of friends, will organize the world’s information.
Not so long ago, Twitter added the possibility of opting into a geo location sharing feature for our tweets, and just yesterday Tech Crunch announced that Facebook is planning to soon launch a new functionality with regard to location, a mobile version of the site using the HTML5 location component to grab your location information from your mobile phone.
On the beta version of the Tales of Things website we are able to connect anything, with any media, anywhere. The website is part of a research project called TOTeM that will explore social memory in the emerging culture of the Internet of Things. Just choose objects that are meaningful to you, photograph them, give it a story, print the QR Code and tag it. Or you can just see other peoples’ memories geographically juxtaposed on Google Maps.
On a different yet related project, Foodspotting is a website / location based game that allows you to upload pictures of food, describe it, and pin it with geo location to the place where you spotted it, even if you do not have a Foodspotting account you can always check which dishes were already spotted, for instance, in Amsterdam.
Inspired by the theme of maps I chose some examples which I think are time relevant and would be interesting to share.
Track and trace Maps
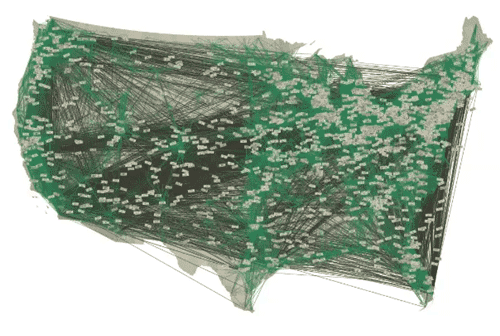
Follow the Money: Human Mobility and Effective Boundaries, video that gathers data from the online bill-tracking game www.wheresgeorge.com
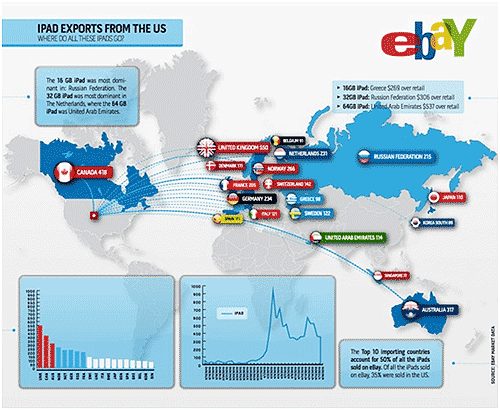
iPad exports through sales on eBay.com. Of all the iPads sold in the first two weeks on eBay, the majority went to buyers outside of the US; just 35% were sold domestically.
Tracking the Oil Spill. A time-lapse animation of the recent oil spill in the Gulf of Mexico.
Tracking Airport Status. A list of airports that have been affected by the ash cloud from the erupting volcano in Iceland.
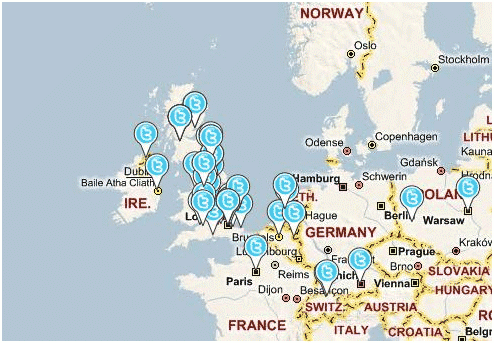
Twitter versus the Volcano. A screen capture of the Bing Maps Twitter application, filtering tweets by the term ‘ash’.
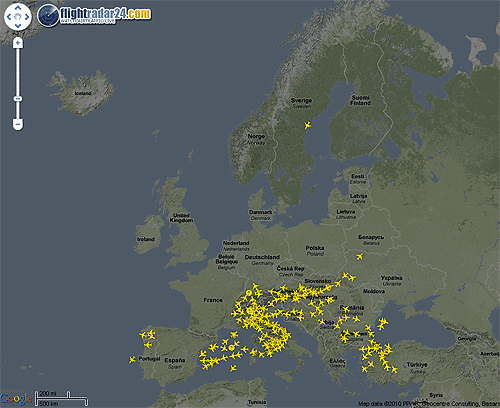
Flightradar24. A screenshot taken on April 16th , when most of the European Airports closed due to the ash cloud.
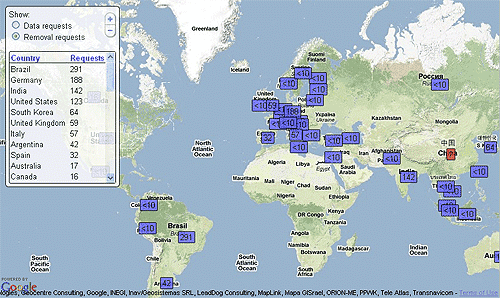
Google Government Requests. Number of government agencies around the world which ask Google to remove content from their services, or provide information about users of Google services and products.
[1] BBC programme “Maps: Power, Plunder and Possession”
