GIS: An Exploration of Non-Existent Maps
Introduction
I’m reminded of the short story On Exactitude in Science by Jorge Luis Borges. He presents an encyclopedia excerpt from a nameless empire of cartographers who, in their pursuit of the perfect map and blinded by their hubris and affinity for precision, created a point-for-point representation of their entire empire. This map however is deemed useless by the preceding generations for its impracticality. Abandoned by the people and beaten by the elements, the map falls into ruin, forgotten and lost. The story has often been cited for its sense of absurdity that such a map would or should even exist. I however want to use this image as an ekphrasis, or a rhetorical device to frame how we imagine maps and geographies today.
For all intents and purposes, I will be using what is most commonly referred to as Geographic Information Systems (GIS) in comparison to Borges’ map. I want to use this system in particular because it is a process rather than a finite object, as most digital objects are. By using this image of a physical copy of an empire, I intend on evoking its elemental and physical properties. Drawing a parallel between these two ideas I hope to present some compelling observations about these two non-existent maps.
I will start with describing exactly what GIS is.
GIS
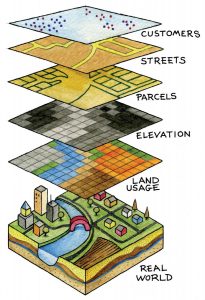
GIS is an intersection of the study of geography and social history (Bailey and Schick, 2009) and allows for an amalgamation of different social information to be represented on top of an existing geography. Rather than being understood as an object, it is better understood as a process. It can broken down into two primary components. The first is the quantitative or qualitative data, that is the type of data that is normally depicted through graphs charts, tables etc… (Bailey and Schick, 2009). Examples of this can be population distribution, population traffic, at what times that traffic occurs, income distribution, weather, and whatever other data points can be collected within a given area. This aspect of GIS is what gives it its ability to change through time. The second is the geographical or “spatial data”. Spatial data is most commonly understood through a coordinate system (e.i. longitude or latitude) or the location with which a piece of collected data can be associated with and linked to (Bailey and Schick, 2009). Popular depictions of the GIS model are typically shown with a physical or real space that has different systems of information layered upon it.
Infrastructure, Elements and the Digitization of Space
This image of a layering of information on top of the physical world I find incredibly provocative. It’s like occupying the same space at different times, an image more commonly associated with multiverse theory rather than media theory. But this amorphous information doesn’t actually exist along side my physical body in physical space and part of what is needed to demystify these systems and processes is to understand where this information exists in the physical world (Mattern 2013; Parks 2015; Dunn 2016).
Much as I would like to visit Borges’ map, I can’t because it doesn’t exist and I can’t reach out and touch the many people who have been tracked walking along the same streets that I walk. Borges’ map only exists in our mind while the information for GIS are built into a framework of servers and cables, buried underground and housed in large buildings privy only to few (Mattern, 2013; Parks, 2015). Just settle on the subtle irony that there is a physical (albeit fictional) map that only exists in our minds and a digital map that only exists inside of metal and plastic objects.
But there is an important distinction that needs to be made here, one about geographic information. While Borges’ map is only concerned with spatial data, GIS is more concerned with attribute data. GIS’s reliance on attribute data make it more of a living object than Borges’ map despite Borges’ map evoking more tactile sensations. But then again his use of this physical descriptor rings true those who study media ecology.
Borges mentions the “Inclemencies of Sun and Winters”, evoking the power of the elements to make decrepit the efforts of man. The setting of this map within the framework of nature is a notion brought forth by John Peters in his book The Marvelous Clouds. He writes that “The elemental legacy of the media concept is fully relevant in a time when our most pervasive surrounding environment
is technological and nature” (Peters pg 2). Borges’ map is framed as being within nature and it is ultimately what destroys it in the end. It is important to understand that both we as a species along with whatever we make to help us adapt to our environment and the environment itself are contingent mutually influential factors (Peters2015).
Narratives
I want to also suggests that the quantitative data which GIS draws upon to make itself a relevant factor is inherently linked to human narrative and activity. In Parks’ essay “Stuff You Can Kick”, she uses the multimedia project “Linemen” by Micheal Parker to situated American electrical infrastructure through the lens of human labor (Parks, 2015). The human component has always been an essential part of the map making process (Caquard, 2011). One need only think of the sense of nationalism one derives from the arbitrary boundaries and boarders they find themselves in to understand the relationship to geography societies have had through history. Coquard writes that “the production of these fictional nationalistic metanarratives has been supported by the modern need to scientifically measure, control, exploit and claim territories with maps” (Caquard, 2011).
But there is another point that needs to made here about the narratives that surround these infrastructures, that the narratives aren’t only about the people who made them, but about the people who use them.
Big Data
In his article “The Urban Geographical Imagination in the Age of Big Data”, Taylor Shelton draws attention to the scale and scope with which data collection methods are implemented by GIS. His article primarily draws on the image of the “smart city” to depict how data collection and digital solutionist methods can create a city devoid or, at the very least, lacking in the modern ailments of urban cities (Shelton, 2017). While he states that, “we have at our disposal a wider array of data and tools of analysis to help us understand social processes, technologies which are thought to be revolutionary for the way we conduct research and discover previously unforeseen knowledge”, he presents a caveat to this in the concern that “there isn’t a single, linear pathway through Big Data that produces a greater understanding of cities and urban processes, much less inherently better outcomes” (Shelton 2017). There is this notion that narrative is both essential but expoitative. He is also skeptical that the influence of data collection and the implementation of its findings he suggests has an effect on the population that the data is being collected from. Shelton quotes Rose-Redwood saying:
“whereas much is known about the history of quantification as a method of geographical analysis, far less research has explored how numerical calculation itself has historically reshaped political practices and the geographies of everyday life. This distinction between quantitative methods in geography and the geography of calculation is significant, because it draws attention to the way in which calculative rationalities have been used to refashion the world in their own image.“ (2012).
Rose-Redwood hits on a sentiments shared by Peters and McLuhan that there is a relationship between the environment and those who manipulate it (Peters, 2015).
Conclusion
Now, it would be unfair to draw a strict analogy between the image of Borges’ map to what it is geographers, software engineers, and social scientist do today. There is much lacking in the ideas of critical cartography that is missing in Borges’ story. I do think that there is something in this image of actuality versus virtuality and I don’t necessarily think that it is one entirely encompassed through a lens of practicality. I consider the two things lacking in Borges’ map are the ability to change over time and human narrative and what GIS lacks is partially related to visibility of its infrastructure. But at the heart of this article isn’t necessarily an exact critique on what is and isn’t missing in these systems. What I want to explore (much in the same way I wish I could explore that fictitious map) is despite what it is that we potentially gain, what is it that we potentially loose through the systems.
References:
Bailey, Timothy. Schick, James. “Historical GIS: Enabling the Collision of History and Geography.” Social Science Computer Review, vol. 27, no. 3, 2009, pp. 291-296.
Caquard, Sebastien. “Cartography I: Mapping Narrative Cartography. ” Progress in Human Geography, vol. 37, no. 1, 2013, pp. 135-144.
Shelton, Taylor. “The Urban Geographical Imagination in the Age of Big Data.” Big Data and Society, vol. 4, no. 1, 2017.
Dunn, Stuart. “Praxes of The Human and The Digital: Spatial Humanities and the Digitization of
Space.” GeoHumanities vol. 3, no. 1, 2016, pp. 88-107.
Borges, Jorge Luis “On Exactitude in Science.” A Universal History of Infamy (translated by Norman Thomas de Giovanni), Penguin Books, London, 1975. ISBN 0-14-003959-7.
Parks, Lisa. “Stuff You can Kick: Toward a Theory or Media Infrastructures.” 2014.
Peters, John Durham. “The Marvelous Clouds: Toward a Philosophy of Elemental Media.” The University of Chicago Press, Chicago, 2015.
Redwood, Rose. “The Numbers in Place: Security, Territory, and the Production of Calculable Space.” Annals of the Association of American Geographers, vol. 102, no. 2, 2012, pp. 295-319.