Running for Research
Contextualizing Research Based on Strava Metro Data
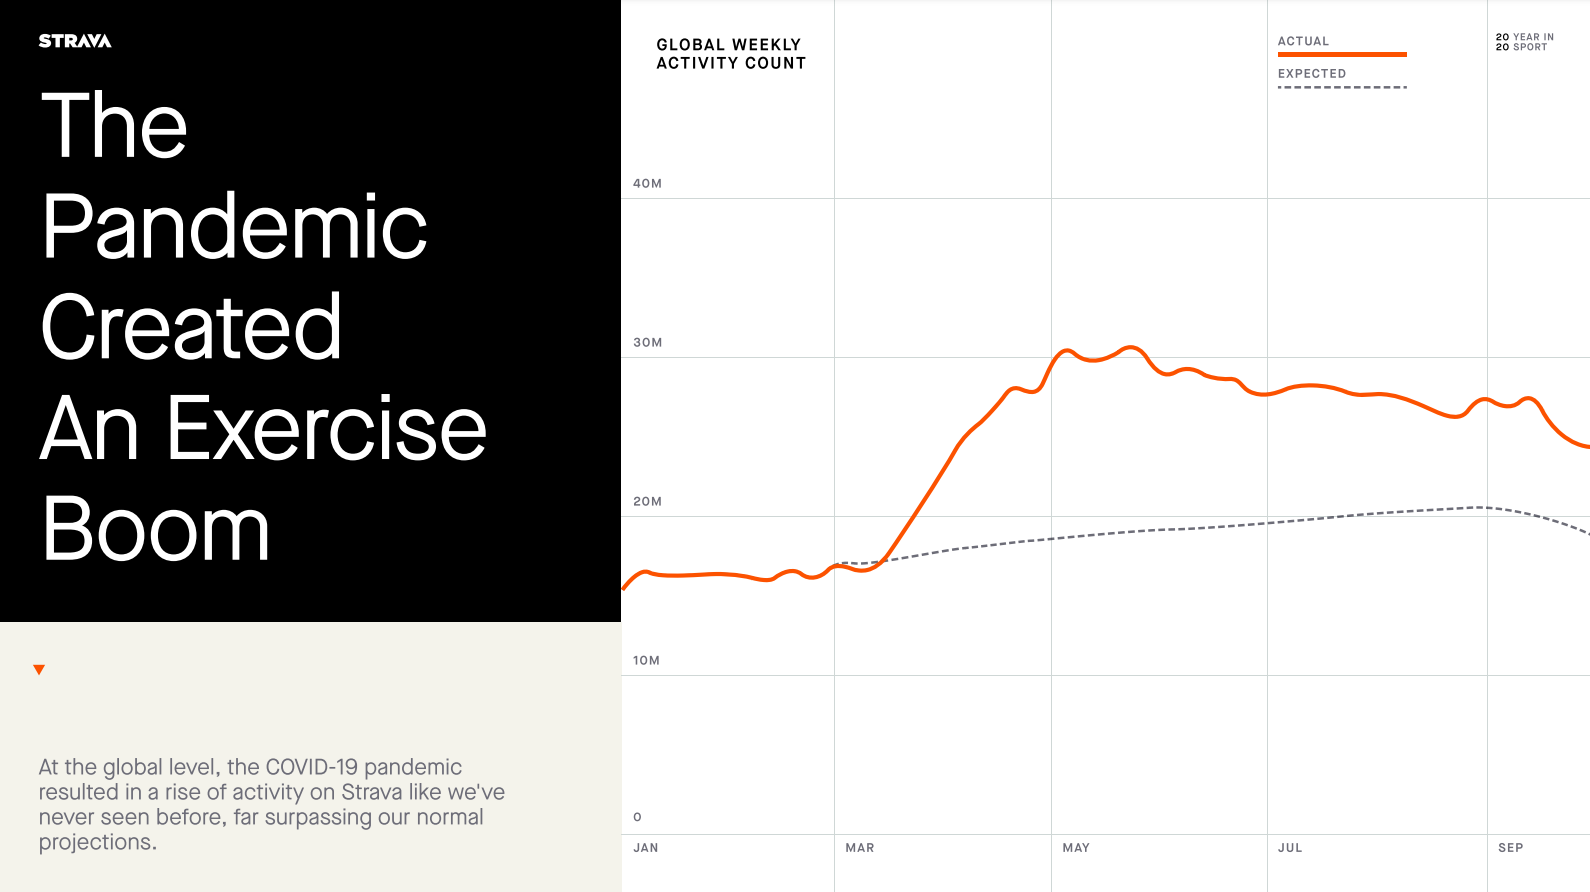
In December 2020, the exercise tracking service Strava released their annual data report, confirming in numbers that the COVID-19 pandemic had changed people’s workout habits.
Forced to spend more time at home, and unable to visit gyms or carry out other forms of indoor sports, many turned to outdoor exercises, such as running or cycling. For 2020, Strava reported a 33% increase in total uploaded activities compared to the previous year. In addition, the service recorded a drastic increase in weekly active user numbers between the months of March and May, the period during which governments around the globe started imposing curfews and other restrictive measures (“Strava Releases 2020 Year In Sport Data Report”).
Prolonged periods of isolation and spatial confinement generated a demand for ways to transform individual physical exercise into a social activity – a demand that Strava was equipped to meet. For many, the platform represented a welcoming digital alternative to a cycling club or a way to run together without actually running together.
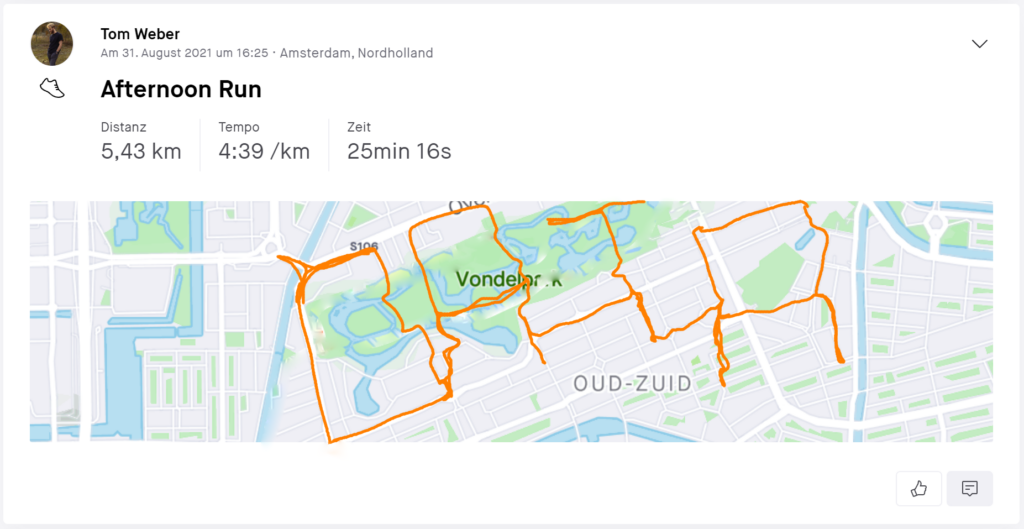
Strava was founded in 2009. The platform, and by extension the app, allows users to record and store their workouts via GPS data.
Social media elements constitute a central part of the Strava user experience: users can follow other profiles and share their workouts with their followers. They can choose to incorporate multimedia elements, such as text, images, or videos whenever sharing an activity. They can view, comment, and “give Kudos” (Strava’s adaptation of the “like button”) to activities that other followed users have shared.
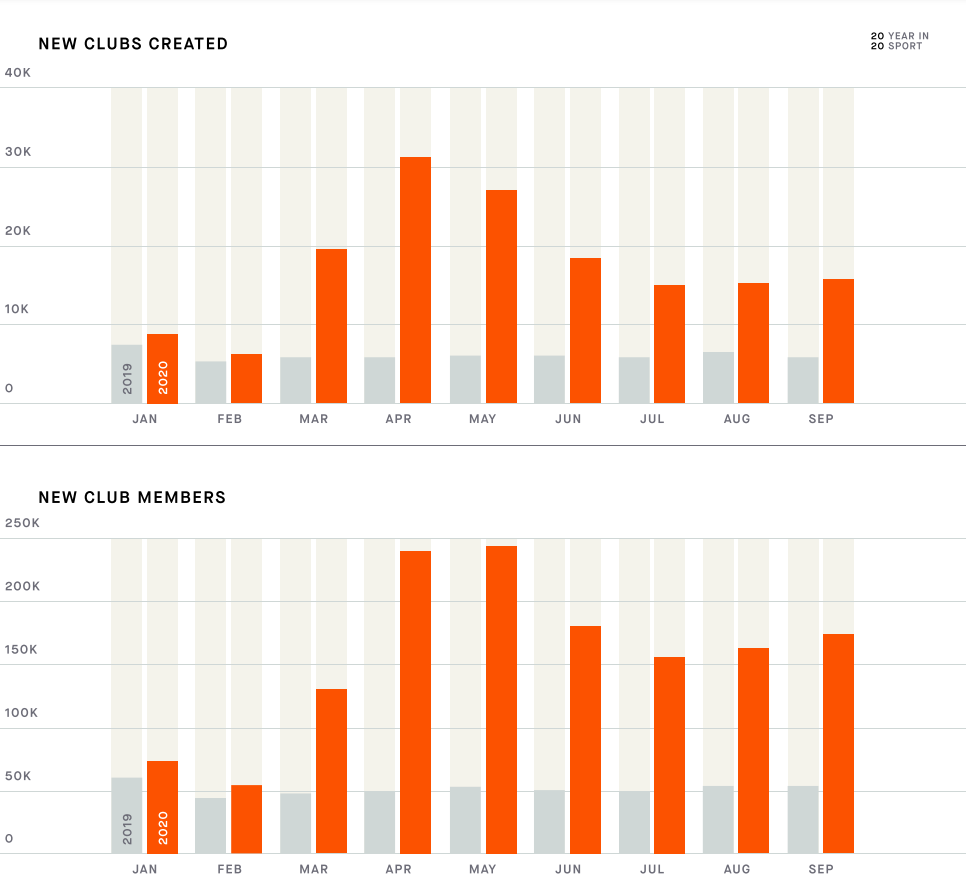
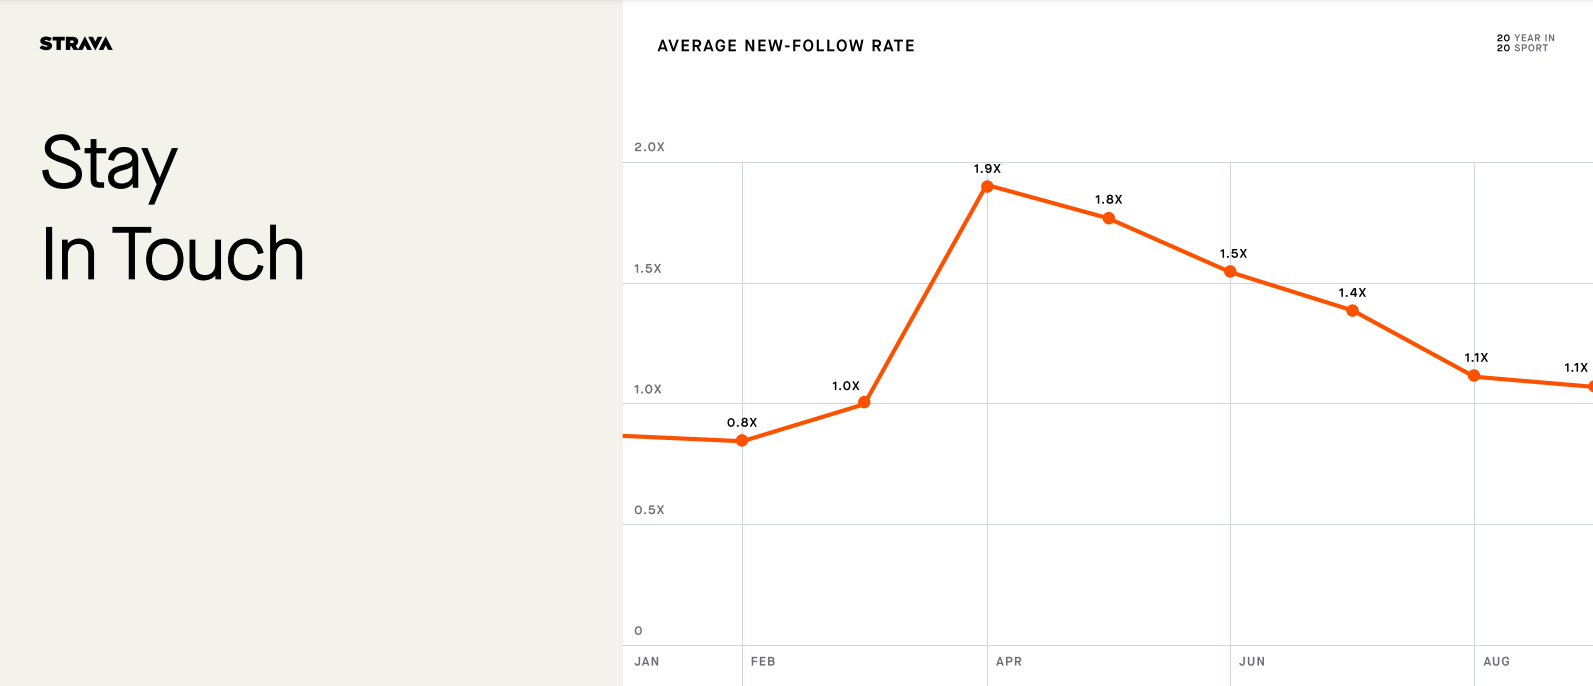
According to Strava’s 2020 annual report, the sharp increase in user numbers and overall interest in the platform over the course of the year extends to the use of the platform’s social features. Athletes have increasingly been making use of the platform’s affordances for exchange and acts of sharing. Between the months of February and May, users followed twice as many new profiles as in the months prior, and created and joined significantly more clubs compared to the previous year (“Strava Releases 2020 Year In Sport Data Report”).
As of 2014, the company makes its user data available (free of charge) to third parties via a service called Strava Metro. According to Strava, the service is an attempt to “help make cities better for anyone on foot or on a bike” (Strava Metro Home). This, as Strava claims, “largest collection of human-powered transport information in the world”, has generated substantial interest among researchers of urban mobility and related phenomena.
However, the possible limitations to Strava Metro data for research purposes, or generally the academic repurposing of digitally generated information that was not generated with research in mind, have been part of the scholarly debate for a number of years already. Scholars acknowledge the representational potential that increasingly large data sets have, yet point to the fact that said data lacks qualitative capacities, and is usually controlled and provided by institutions or organizations with interests of their own, in turn raising concerns around matters of ethics and representation.
Tommaso Venturini et. al. compile a set of recommendations for the “digital methods approach” (essentially the study of social phenomena through digitally generated artifacts). They use the notion that digital artifacts are in ways inseparable from the platform or medium on which they were created (inspired by McLuhan’s “the medium is the message” (1964)), as a point of departure to highlight layers of complexity often overlooked in Digital Methods.
Drawing on previous research in the field, the authors emphasize that research on digital media objects often relies on the repurposing of information or “digital traces” that were initially not generated for research purposes – even though large in quantity, they lack qualitative research value (Venturini et al.).
Further, and referencing previous research, Venturini et. al. challenge the notion that interactions in digital environments function as naturally evolving “media ecologies”, by emphasizing that said environments are carefully constructed and curated by those who create, use, and maintain them. Information gathered in digital environments is therefore often preceded by personal or corporate interest of those who develop and own the respective environment and act as “gatekeepers of their traceability” (Venturini et al. 4197).
In their review of existing research that uses Strava Metro data for bicycle monitoring, Lee and Sener point out that Strava Metro provides large data sets in a field that was often limited by lack of available information, and emphasize the service’s contribution to urban mobility research. However, the authors identify strong limitations to the usability of Strava data in research contexts, pointing to a “discrepancy between Strava samples and general populations, raising concerns about the under- and over-representativeness of populations” (Lee and Sener 42). Lee and Sener emphasize that Strava data was not generated with research purposes in mind and, therefore, tends to lack crucial details that would allow studies utilizing said data to yield more conclusive results (41).
Colin Ferster et. al. use Strava Metro data for their 2021 study of bicycling exposure and safety risk in Ottawa, Canada. Fester et. al. emphasize the advantages of Strava data over traditional survey or count data in terms of spatial and temporal continuity, but underline the representational limitations of said data for research – “Strava data best represent the people who use the app the most, and different apps can attract users with particular bicycling behaviors” (Ferster et al. 4).
In their 2019 study of effects on bicycle trip volume in Miami-Dade county using Strava data, Hartwig Hochmair et. al. highlight that Strava users tend to be male and younger. However, the authors underline the extensive coverage of Strava data, pointing out that the App generates insights that would otherwise require massive measuring infrastructures, such as networks of cameras, infrared sensors, or manual counting initiatives (Hochmair et al.).
This quick overview of contemporary research using Strava Metro data reflects the tendencies identified by Venturini et al. within the context of Digital Methods: Data generated in non-research contexts, reappropriated for academic purposes, has limitations.
Strava data is inevitably skewed, as it naturally only accounts for users who decide to use the platform over any other out there – a conscious, individual choice and therefore not representative of a general public. These and other representational limitations are reflected in all three studies referenced above.
Mirroring Venturini et al.’s critique of the notion of “media ecologies”, (inter)actions on Strava and, in turn, data generated via the platform, do not occur and evolve naturally. Instead, they are a product of a set of carefully planned, developed, and monitored technological and social affordances. Further, Strava as a corporate entity is acting as gatekeeper to their data, granting access to Strava Metro solely via an application process to companies or institutions they regard as suitable.
As a result of the COVID-19 pandemic, Strava Metro, the world’s “largest collection of human-powered transport information” (Strava Metro Home) has become even larger.
Has this quantitative increase resolved concerns around the validity of research using that data? Is a bigger database a better database?
Contemporary research suggests that it has not. Scholars using Strava Metro data today, wrestle with the same lack of qualitative research value and issues around matters of representation that were relativizing research outcomes when the data set was much smaller – scholars employing data for research, no matter the quantity, have an obligation to critically question the source of their data and their motivations for providing it in the first place.
Works Cited
Ferster, Colin, et al. “Mapping Bicycling Exposure and Safety Risk Using Strava Metro.” Applied Geography, vol. 127, Feb. 2021, p. 102388. DOI.org (Crossref), https://doi.org/10.1016/j.apgeog.2021.102388.
Hochmair, Hartwig H., et al. “Estimating Bicycle Trip Volume for Miami-Dade County from Strava Tracking Data.” Journal of Transport Geography, vol. 75, Feb. 2019, pp. 58–69. ScienceDirect, https://doi.org/10.1016/j.jtrangeo.2019.01.013.
Lee, Kyuhyun, and Ipek Nese Sener. “Strava Metro Data for Bicycle Monitoring: A Literature Review.” Transport Reviews, vol. 41, no. 1, Routledge, Jan. 2021, pp. 27–47. Taylor and Francis+NEJM, https://doi.org/10.1080/01441647.2020.1798558.
Strava Metro Home. https://metro.strava.com/. Accessed 3 Oct. 2021.
“Strava Releases 2020 Year In Sport Data Report.” Strava, https://blog.strava.com/press/yis2020/. Accessed 2 Oct. 2021.
Venturini, Tommaso, et al. “A Reality Check(List) for Digital Methods.” New Media & Society, vol. 20, no. 11, SAGE Publications, Nov. 2018, pp. 4195–217. SAGE Journals, https://doi.org/10.1177/1461444818769236.