YourTube: A Project to Detect the Bias Within the YouTube Algorithm
The YouTube recommender algorithm may be influencing your life more than you know. We might have a solution for that.
A project by: Dilara Akdemir, Betsy Brossman, Gaurika Chaturvedi, and Noyan Er
Introduction
On YouTube, amateurs and professionals are free to upload or consume content ranging from a 30-second video of a boy at the zoo to full-length news reports. A user’s first interaction with the site is the homepage, but this homepage, however, is not an identical place for all users, for an opaque algorithm is used to personalize user experience. Our guiding question is – “Does a YouTube user’s age, gender, language, and country of usage affect what they are recommended on their homepage”. To answer this question, we create eight different sock puppet accounts that differ in these categories. We compare their associated homepages before and after subscribing to the same YouTube channels to investigate the differences that might appear based on the socket puppet’s demographic factors.
We are also creating YourTube so that users can see these differences for themselves. YourTube is a place where users can view the homepages of other YouTube users and compare their own homepage experiences. There is not much research completed specifically on the homepage of YouTube and our project aims to fill that gap. Greater emphasis has been put on the search results of YouTube which have a similar algorithmic issue, for “The entanglement of algorithmic work in the attribution of relevance is clearly visible: the arrangement in the form of ranked lists reinforces the idea that some contents deserve more prominence than others’’ (Rieder et al., 2018). With the creation of YourTube, we aim to spread this awareness beyond solely media professionals/students and make the platform easily accessible for those who may have no former realization of how curated their content truly is, for simply being aware of the filter in which you live is the first step in decreasing communication gaps.
Theory
Recommender algorithms are agents that define a crucial aspect of the user experience on social media platforms. The effects of algorithms on individualization through the process of curating content have been a focal point of academic debate. User-generated content is being created at such a pace that the technicalities tasked with the curation of these (i.e. algorithms) might not be able to perform the task. (Bozdag, 2013).
Bozdag (2013) proposes a “model of filtering for online web services including personalization’’ within which location, user preferences, and user actions are included as factors determining the processing of information by personalization algorithms (p. 214). These algorithms used in creating a personalized experience, however, are also being held responsible for the “filter bubble” phenomena. Pariser (2011) conceptualizes the filter bubble with an emphasis on user actions: “The new generation of Internet filters looks at the things you seem to like—the actual things you’ve done, or the things people like you like—and tries to extrapolate” (p. 14). Pariser argues that although publishers were always interested in the preferences of their audiences, the “filter bubble” is a different phenomenon in that the individual is alone in it through specific personalization, the bubble is invisible since it is to be observed in platforms that target the general public as a whole whereas political rhetoric in traditional media publishers are easily detectable by the audience and finally that the individual doesn’t actively choose to enter the filter bubble whereas, in conventional broadcast media, individual curation is a more active process (Pariser, 2011, p.14).
The invisibility of the filter bubble calls for an approach that would not only discuss the problems of algorithmic bias but would rather put emphasis on the visibility of this phenomenon. It would also be an innovative approach to implement a collective approach to tackle the loneliness aspect of the filter bubble. Visualization of this problem through a collective call to action would also have an emphasis on user demands: “It is evident that an individual embracing tool for encrypting communications represents a rather different phenomenon than a global advocacy network established to demand greater algorithmic accountability’’ (Beraldo & Milan, 2019, p. 7).
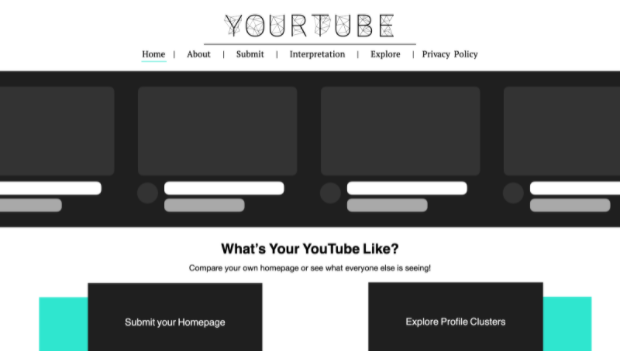
YourTube Website
We have chosen to achieve our purpose through a website dedicated to data visualisation. Reliance on another platform requires subscribing to the values inscribed in it. However, a website is customisable and scalable. This allows us to structure the user experience in a way that better guides visitors to be critical. Furthermore, we can add more capabilities of data visualisation and opportunities for profile comparison. Although just looking at one’s homepage might be interesting, the opportunity to compare that data with a much larger aggregate is what is appealing about our project.
Since we aim to be able to compare many diverse homepages, data visualisation can be a useful way to communicate this information (Tufte, 2001). Thus, the visualisations will be the landing page for the website. The user will have the option to read the instructions on how to submit their homepage data or jump directly to the submission and visualisation section. Before a submission is made, a pre-submitted random profile is selected, and the website will show the visualisations associated with it.
To submit their own data, users must first install the ytTREX (YouTube Tracking Exposed, n.d.) extension to their browser. Then they must go to their personal page and click on the “Homepage Content” button next to “download csv”. They can submit this csv file, along with self-reported age, gender, primary language of usage, and country of usage, through a form on the website.
One of the limitations of using the ytTREX extension is that it is primarily used on a desktop. On mobile devices, YouTube is also accessed through the YouTube application rather than a browser. However, we argue that this limitation is overcome by the fact that the homepage on Desktop is informed by the account’s YouTube usage on other devices.
For the purposes of comparison, we intend to cluster the homepages submitted using a Jaccard indicator which measures “the similarity of two sets” (Xu & Tian, 2015, p. 170). This will be done on the level of videos and the level of channels. One of the drawbacks of using Machine Learning for classification is that there may be clusters which are difficult to interpret. Thus, the human intervention of reviewing clusters for coherency before being present for comparison on the website will exist. This is not to say incoherent clusters will not be accessible, however, coherent clusters will be named to make them easier to find and review. These clusters can be viewed in the form of a network visualisation employing a “force vector” algorithm (Venturini, 2014).
Informed by the principles of reduction and spatial variables (Manovich, 2011), we will provide some macro level visualisations regarding the most popular channels and videos in that profile cluster. Furthermore, visitors can interact with the visualisations by controlling the aforementioned demographic factors and the level of analysis. Additionally, to allow users to explore the data, we will be taking a “direct visualisation” approach (Manovich, 2011). “Direct visualisation” refers to the visualisation of visual objects without the reduction through representation (Manovich, 2011). Thus, we will have a “feed competition” where users can compare their homepage with that of other clusters to see the differences in the subjective experience of the platform (Rogers, 2021).
We think it is important to communicate our role as curators and how the actual data curation is occurring. Thus, we shall have a subpage communicating our values, role, skillset, and knowledge base to be reflexive about how our experience has shaped the form of the project. Additionally, two pages communicating how the visualisations are being made based on the data submitted — one on a surface level and one on a technical level — will also be present. This is intended to communicate what knowledge can be drawn from our visualisations. For instance, the network visualisations of profile clusters will be accompanied by Venturini’s reading principles (2021).
To avoid violating the trade dress copyright of YouTube’s User Interface, our comparative profile visualisations will not use YouTube’s UI. Videos will be displayed in the same order as present on the YouTube homepage without any characteristic features such as the sidebar, search bar, and YouTube logo. Furthermore, the videos will be embedded into the visualisation to avoid using copyrighted thumbnails.
We expect that some users may have privacy concerns regarding the data collection of this project. Firstly, we ask that each user consents to our “Terms and Conditions” agreement that gives us permission to access their one-month YouTube data and share only their gender, age, language, and country of usage with others using the platform. This statement will declare in detail the data privacy policies and data security policies we must legally abide by. Unlike sites like Instagram, this personal data will be shared with no other companies, and the Terms and Conditions will legally explain “the ways in which users can control how and what information about them is being collected and stored” (Steinfeld, 2016). The social security numbers of our users will not be collected; each user will be administered a unique reference number to safeguard their privacy.We expect to rent a web/database server from Microsoft Azure which will then be stored in their European region. With this European-based storage, we understand that our site will be subject to the GDPR, the General Data Protection Regulation. This agreement will ensure that we responsibly store this data to comply with European law. Our main demographic is likely YouTube users, but we might have researchers who will be interested in the comparisons we make. To demonstrate how our project might be useful in this regard we are also running our own research in parallel as discussed below.
Methodology: Sock-Puppet Research
The selection of the method adopted for this study was made based on the emphasis on intervening and highlighting the biases of the YouTube recommender algorithm affecting the “home” page recommendations and visualizing these biases. Therefore, we concluded that a “sock puppet” method paired with data collection using the YouTube Tracking Exposed tool would be a fitting and direct approach in collecting and analyzing data.
Sock puppets are usually associated with fraud, spamming, cyberbullying, and discrimination (Sweney, 2008). In digital media, a sock puppet is defined as “A user account that is controlled by an individual (or puppetmaster) who controls at least one other user account” (Wang, et al., 2018). Sock puppets in this study, however, are used differently since the actions taken by them would be limited to visiting the homepage and subscribing to channels only.
For this study, language, country, age and gender were controlled variables as we wanted to see the differences in recommendations related to these factors. Another point of inquiry is the effect of subscriptions to YouTube channels on the different “home” pages. To observe these, eight different sock puppets were created of which four selected “Germany” and “German” as location and language preference. For the other four accounts “Turkish” and “Turkey” were selected. Half of the accounts were female, and the other half were male and half of them were twenty and the other half fifty years old. These accounts subscribed to thirty channels which were selected from the fifty most influential YouTube channels on the social media analytics platform Socialblade (Socialblade, n.d.).
Another issue when constructing the methodology were the policies and regulations that would concern our method. The terms of the YouTube community state that users should not “access, reproduce, download, distribute, transmit, broadcast, display, sell, license, alter, modify or otherwise use any part of the Service or any Content except: (a) as specifically permitted by the Service; (b) with prior written permission from YouTube and, if applicable, the respective rights holders; or (c) as permitted by applicable law…’’ (YouTube, 2021). In the light of these statements, it would seem problematic to use copyrighted material (in our case, the video thumbnails) in the research. However, drawing on the statement emphasizing fair use under the applicable law; the EU directive The harmonisation of certain aspects of copyright and related rights in the information society states that exceptions regarding the limitations in the use of copyrighted material may apply for “use for the sole purpose of illustration for teaching or scientific research, as long as the source, including the author’s name, is indicated, unless this turns out to be impossible and to the extent justified by the non-commercial purpose to be achieved, without prejudice to the exceptions and limitations provided for in Directive (EU) 2019/79’’ (Directive 2001/29/EC). It is therefore concluded that the method does not infringe with the community guidelines.
Analysis: Sock-Puppet Research and Discussion
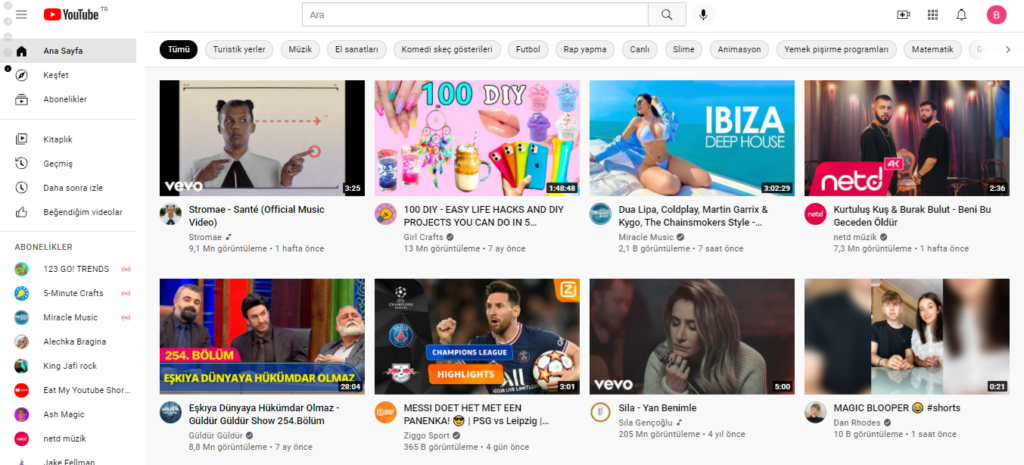
Our research shows that by only following 30 channels, the YouTube algorithm suggested different videos stereotypically more related to the younger, 20- years old, female sock puppets for both Turkish and German users. Comparing the homepages of both younger females before and after subscribing to other channels with the male sock puppets, it is noticeable how the younger female accounts are more pop music-oriented. However, both the German and Turkish male sock puppets, on the other hand, got football-related videos, before and after subscribing to the channels. Consequently, we noticed a slight categorization where the female sock puppets were recommended more music and food-related videos, whereby the male users were led towards watching sports.
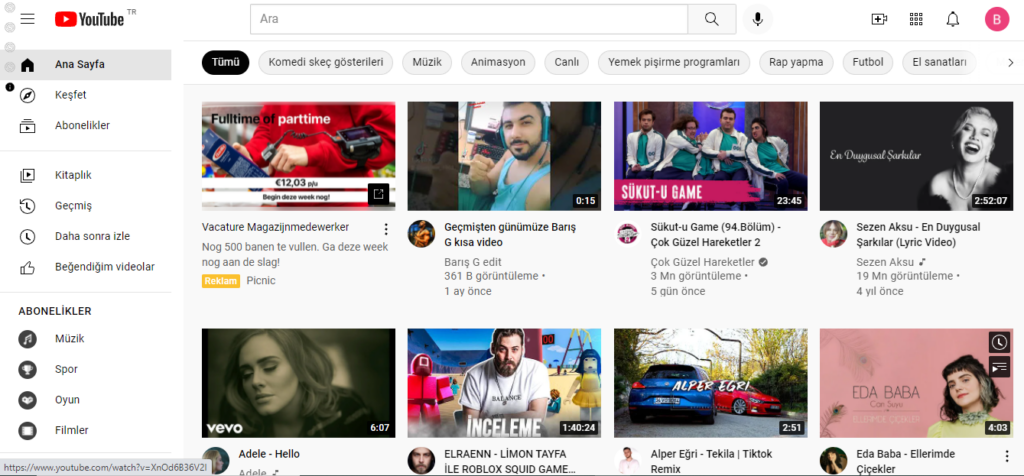
Apart from that, we noticed how only the first four suggested video rows seem to take the interest of the user based on the subscribed channels and their identity criteria, such as age, gender, location, and language, into account since the suggested video of the 5th and last row have similar content compared to from and after subscribing to channels.
Another observation was that on the homepage from the German, 50-year-old female, the suggested videos related to Covid-19 remained after subscribing to other channels, different from the 20-year-old female who got different more interest-related videos suggested. Speculating, it could be due to the age criteria. On the contrary, all the sock puppet users seem to have a variety of the same videos recommended, such as Squid Game content, DIYs, or food challenges, after subscribing to the same channels despite their age, gender, location, and language.
The result of our research is solely based on viewing and visually presenting the homepage of our different sock puppets before and after subscribing to the same 30 YouTube channels. But even though we did not actively use the subscribed channels, nor our sock puppet accounts by watching videos, liking, or commenting, we still noticed slight differences in the recommended videos based on gender, age, location, and language. Due to this approach, we are aware of the limitation of our research and assume based on our findings that the results of the homepages would be more severe if there was more individual action of the users with their YouTube accounts. However, since our results did find stereotypical video recommendations, we argue for the importance of the intervention of our app where users can compare their homepages to see how their homepage might differ from others based on their intersections.
Another limitation is that we got Dutch videos recommended despite our location and language since Google knows the current location of our laptops. Thus, Turkish or German users with the same intersections as our sock puppets in Germany or Turkey might get different results displayed than we did.
Conclusion
Our findings show that YouTube makes some assumptions about the user based on the information entered during account creation, that is, before the user has used the platform. After completing our research, the answer to our research question – Does a YouTube user’s age, gender, language, and country of usage affect what they are recommended on their homepage? – is yes. In this way YouTube is implicated in the reification of hegemonies associated with various identities, for instance, gender roles.
A methodological challenge we encountered was associated with the lack of academic understanding of how YouTube’s recommendation system concretely works. Since we don’t know exactly what metrics the YouTube recommender uses in which way, we relied on the “subscribe’’ action to provide each sock puppet with a different “home” page whereas it can be argued that other metrics such as average time spent on each page or how a sock puppet is landing on a page can affect the recommendations. A subsequent project can aim to consider these factors and account for the influence of user behavior on recommendations instead of being limited to demographic factors.
References
Beraldo, D., & Milan, S. (2019). From data politics to the contentious politics of data. Big Data & Society, 6(2), 1-11. https://doi.org/10.1177/2053951719885967
Bozdag, E. (2013). Bias in algorithmic filtering and personalization. Ethics and Information Technology, 15(3), 209-227
Directive 2001/29/EC. The harmonisation of certain aspects of copyright and related rights in the information society. European Parliament, Council of the European Union. https://eur-lex.europa.eu/eli/dir/2001/29/2019-06-06
Manovich, L. (2011). What is visualisation?, Visual Studies, 26:1, 36-49, DOI: 10.1080/1472586X.2011.548488
Pariser, E. (2011). Bias in Algorithmic Filtering and Personalization. Penguin Books.
Rieder, B., Matamoros-Fernández, A., & Coromina, S. (2018). From ranking algorithms to ‘ranking cultures.’ Convergence: The International Journal of Research into New Media Technologies, 24(1), 50–68. https://doi.org/10.1177/1354856517736982
Rogers, R. (2021). Visual media analysis for Instagram and other online platforms. Big Data & Society, 8(1), 20539517211022370
Steinfeld, N. (2016). “I agree to the terms and conditions”: (How) do users read privacy policies online? An eye-tracking experiment. Computers in Human Behavior, 55(), 992–1000. doi:10.1016/j.chb.2015.09.038
Sweney, M. (2008). Should stealth marketing be regulated? The Guardian. https://www.theguardian.com/media/organgrinder/2008/may/21/shouldcommercialbloggingbe
YouTube Tracking Exposed. (n.d.). Retrieved 26 October 2021, from https://youtube.tracking.exposed/
Top 50 Influential YouTube Channels (Sorted By SB Rank). (n.d.) Social Blade. Retrieved October 23, 2021, from https://socialblade.com/youtube/top/50
Terms of Service. (2021, June 1). YouTube. Retrieved October 23, 2021, from https://www.youtube.com/static?gl=TR&template=terms
Tufte, E. R. (2001). The Visual Display of Quantitative Information. 2nd ed. Cheshire, Conn: Graphics Press.
Venturini, T., Jacomy, M., & Jensen, P. (2019). What Do We See When We Look at Networks. An Introduction to Visual Network Analysis and Force-Directed Layouts. SSRN Electronic Journal. Published. https://doi.org/10.2139/ssrn.3378438
Wang, J., Zhou, W., Li, Ji., Yan, Z., Han, J., Hu, S. (2018). An Online Sockpuppet Detection Method Based on Subgraph Similarity Matching. IEEE Intl Conf on Parallel & Distributed Processing with Applications, Ubiquitous Computing & Communications, Big Data & Cloud Computing, Social Computing & Networking, Sustainable Computing & Communications, pp. 391-398, doi: 10.1109/BDCloud.2018.00067
Xu, D., & Tian, Y. (2015). A comprehensive survey of clustering algorithms. Annals of Data Science, 2(2), 165-193.